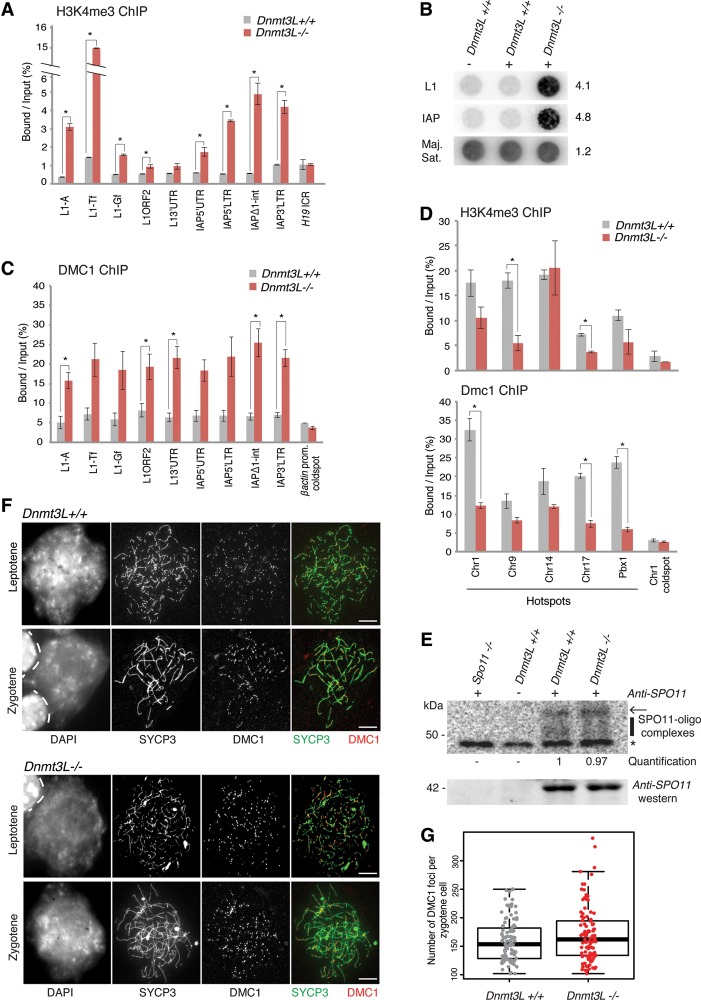
Figure 4.
TE derepression remodels the meiotic chromatin landscape in Dnmt3L−/− spermatocytes. (A) Enrichment of H3K4me3 marks over TE sequences. ChIP was performed on Dnmt3L+/+ and Dnmt3L−/− testis cells; enrichment over several TEs and the H19 ICR was estimated by qPCR. Error bars indicate the SEM of two to three biological replicates. (*) P < 0.05, Student's t-test. (B) Enrichment of SPO11 cutting sites at TE sequences. SPO11-associated ssDNA fragments were immunoprecipitated from 12 dpp wild-type and 13 dpp Dnmt3L−/− testes. Dotted DNA was hybridized with L1-Tf and IAPEz full-length probes. Loading was controlled by hybridization with a major satellite DNA probe. (Right) Quantification of relative intensity in Dnmt3L−/− versus Dnmt3L+/+ testes (wild-type value set to 1). (C) Enrichment of the meiotic repair enzyme DMC1 over TE sequences by ChIP-qPCR. The β-actin promoter was used as a negative control for DMC1 enrichment. Error bars are as above. (D) Usage of canonical recombination hot spots. Five hot spots and one cold spot were assessed for H3K4me3 (top panel) and DMC1 (bottom panel) occupancy by ChIP-qPCR. Error bars are as above. (E) Estimation of total DSB numbers by end labeling of SPO11-associated ssDNA fragments. Immunoprecipitation was performed from whole-testis extracts of 18 dpp Dnmt3L+/+ and Dnmt3L−/− mice; a Spo11−/− adult mouse was used as a negative control. (Top) Autoradiograph of SPO11 oligocomplexes. (Arrow) Position of contaminating immunoglobulin heavy chains; (vertical line) SPO11 oligonucleotide signals ranging from 20 to 35 nt; (*) nonspecific terminal transferase labeling. (Middle) Quantification of SPO11 oligocomplex relative abundance in Dnmt3L−/− versus Dnmt3L+/+ testes (wild-type value set to 1). (Bottom) Anti-SPO11 Western blot. (F) Estimation of total DSB number by immunocytological detection of DMC1 foci. Representative images of double-immunofluorescence staining of SYCP3 (green) and DMC1 (red) on Dnmt3L+/+ and Dnmt3L−/− cells are presented. Bars, 10 µm. (G) DMC1 foci counting per zygotene spermatocyte in Dnmt3L+/+ and Dnmt3L−/− mice. Each dot is the count from a single cell. Box plots show the median and the first and third quartiles of the data, and whiskers show the maximum and minimum data points. One-hundred cells were analyzed per genotype (three mice per genotype).

