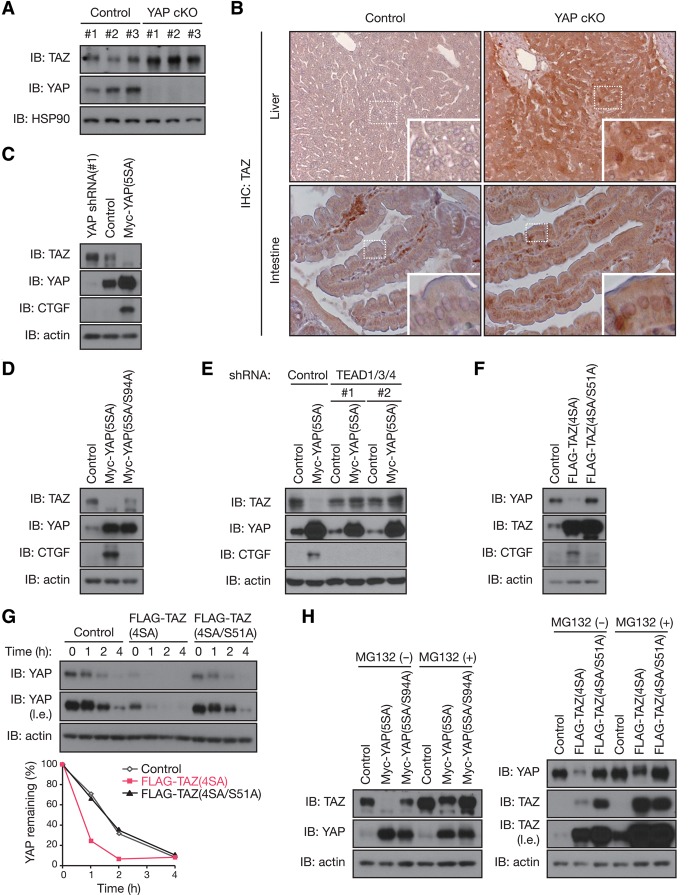
Figure 1.
YAP and TAZ negatively regulate each other via TEAD-mediated transcription. (A) TAZ accumulates in the livers of YAP knockout mice. Immunoblot (IB) analysis of liver extracts from control and liver-specific YAP cKO mice with antibodies to the indicated proteins is shown. n = 3 mice per group. (B) TAZ accumulates in YAP-deficient tissues. Immunohistochemical (IHC) staining of TAZ was performed on paraffin-embedded liver and intestine tissues from control and liver- or intestine-specific YAP cKO mice. Shown at the bottom right are higher magnifications of the indicated boxed regions. (C) The abundance of TAZ is inversely regulated by YAP expression. MCF10A cells stably expressing Myc-YAP(5SA), shRNA specific for YAP, or control vector were subjected to immunoblot analysis. (D) TEAD-binding of YAP is required for YAP-induced TAZ reduction. MCF10A cells with Myc-YAP(5SA), Myc-YAP(5SA/S94A), or control vector overexpression were subjected to immunoblot analysis. (E) TEADs are required for YAP-induced TAZ reduction. MCF10A cells stably expressing Myc-YAP(5SA) (or control vector) were infected with lentiviruses encoding shRNAs specific for TEAD1/3/4. Immunoblot analysis was performed with the indicated antibodies. (F) Active TAZ decreases YAP. MCF10A cells were infected with retroviruses encoding Flag-TAZ(4SA) or Flag-TAZ(4SA/S51A) or with empty retrovirus (control). Cell lysates were immunoblotted with the indicated antibodies. (G) TAZ facilitates YAP degradation. MCF10A cells infected as in F were exposed to 100 μg/mL cycloheximide for the indicated times and then subjected to immunoblot analysis. The percentage of YAP remaining after the various incubation times was quantitated by image analysis. (l.e.) Long exposure. (H) Inhibition of proteasomal degradation blocks mutual regulation between YAP and TAZ. MCF10A cells stably expressing the indicated constructs were exposed to 10 μM proteasome inhibitor MG132 for 10 h and then subjected to immunoblot analysis. See also Supplemental Figure S1.

