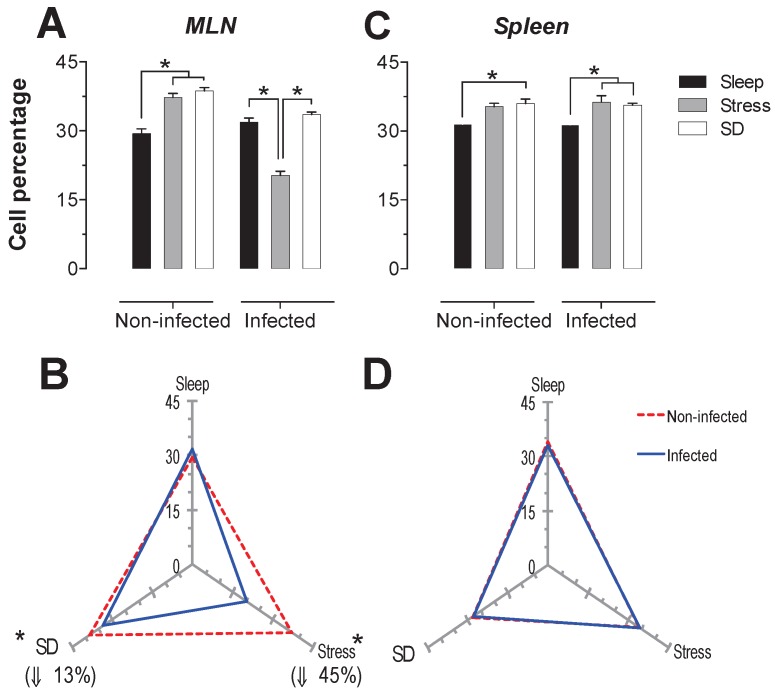
Figure 2.
Total T cell (CD3+) percentages in the mesenteric lymph nodes (MLN) and spleen. Sleep-sufficient (open bars), stress (shaded bars) and sleep deprivation (SD) (solid bars) conditions in the MLN (A) and spleen (C) are classified in infected and uninfected groups. Panels B and D show the differential effect of infection in the three study conditions: sleep-sufficient, stress and SD in the MLN (B) and spleen (D). The dashed red line represents the percentage of T cells (CD3+) in uninfected groups; the solid blue line represents the percentage of T cells in the infected groups. *p<0.05 indicates significant differences between the infected vs. uninfected groups. In the uninfected groups, the percentage of T cells decreased in the SD condition compared to the condition of stress in the MLN, whereas in the spleen, SD and stress induced an increase compared to the sleep-sufficient condition. The infection induced a significant decrease only in the stress condition in the MLN, whereas in the spleen, a significant decrease was observed in both the stress condition and the SD and sleep-sufficient conditions. Experimental group were shown as an average ± standard error and analysed by means of a two way-ANOVA and Bonferroni as a post hoc test. Differences were considered significant when p< 0.05.

