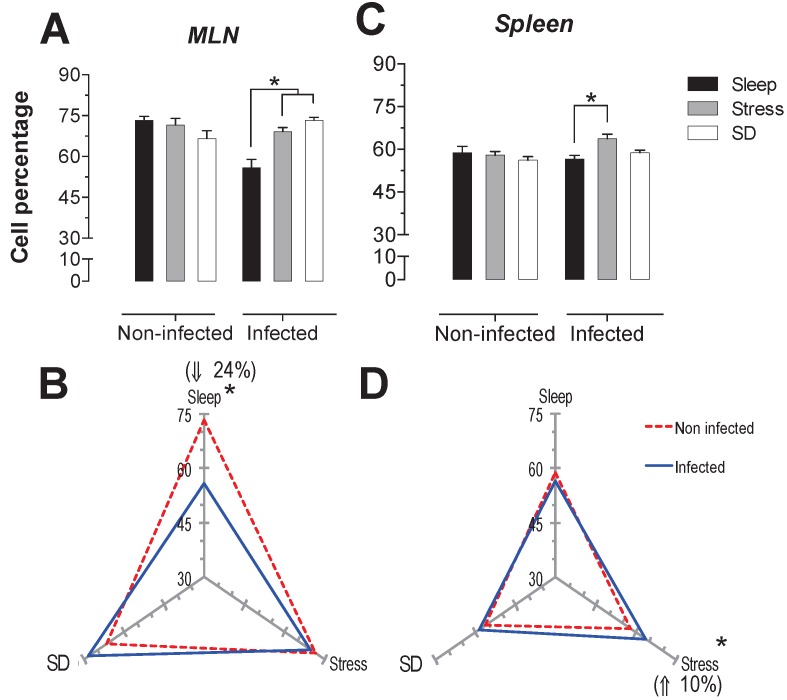
Figure 6.
Percentage of natural killer cells (NK1.1+) in the mesenteric lymph nodes (MLN) (A) and spleen (C) for the sleep-sufficient (open bars), stress (shaded bars) and REM sleep deprivation (SD) (solid bars) conditions in infected groups and uninfected groups *p<0.05%. Panels B and D show the differential effect of infection in the three study conditions, sleep sufficiency, stress and SD, in the MLN (B) and spleen (D). The dashed red line represents the percentage of T cells (CD3+) in the uninfected groups; the solid blue line represents the percentage of T cells in the infected groups. *p<0.05%; the per cent change with respect to the uninfected group is shown. In uninfected groups, the SD and stress conditions increased the percentage of NK cells compared to the condition of sleep-sufficiency and stress in the MLN, whereas in the spleen, SD induced an increase compared to both the sleep-sufficient and stress conditions. When the animals were infected, the SD and stress conditions produced a significant decrease in the MLN, but in the spleen, the SD condition induced a significant increase compared to the sleep-sufficient condition. The infection induced a significant increase in the three conditions, and when the animal had sufficient sleep, the infection produced the greatest difference in the MLN, whereas in the spleen, the infection appeared to be irrelevant.

