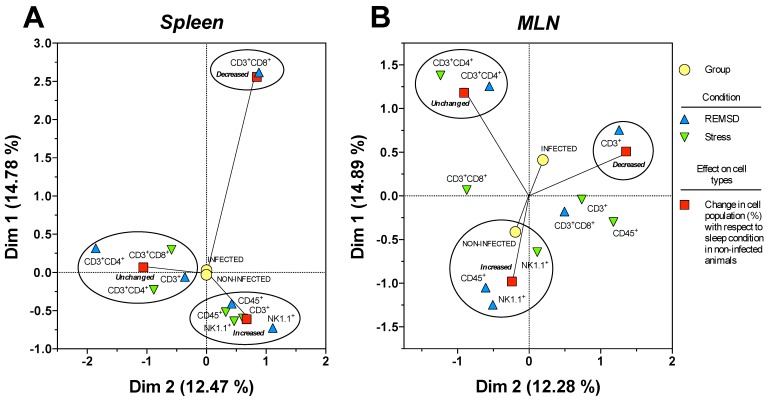
Figure 7.
Multiple correspondence analysis of the association pattern between the differential changes in the percentages of circulating immune cell populations and REM sleep (REMSD) deprivation or stress induction in the (A) mesenteric lymph nodes (MLN) and (B) spleen from uninfected rats or rats infected with Trichinella spiralis. The strength of the association between variables can easily be interpreted in relation to the distance separating two adjacent points: the lesser the distance, the greater the association between categories (differential change, cell type, condition and group). The strength association between variables is interpreted in terms of the relative positions (distance), of the points of the two dimensions (Dim1 and Dim2). Each dimension explain the behavior for each cell population analysed, and associates the response to treatment and condition type, this explain is represented as percentage.

