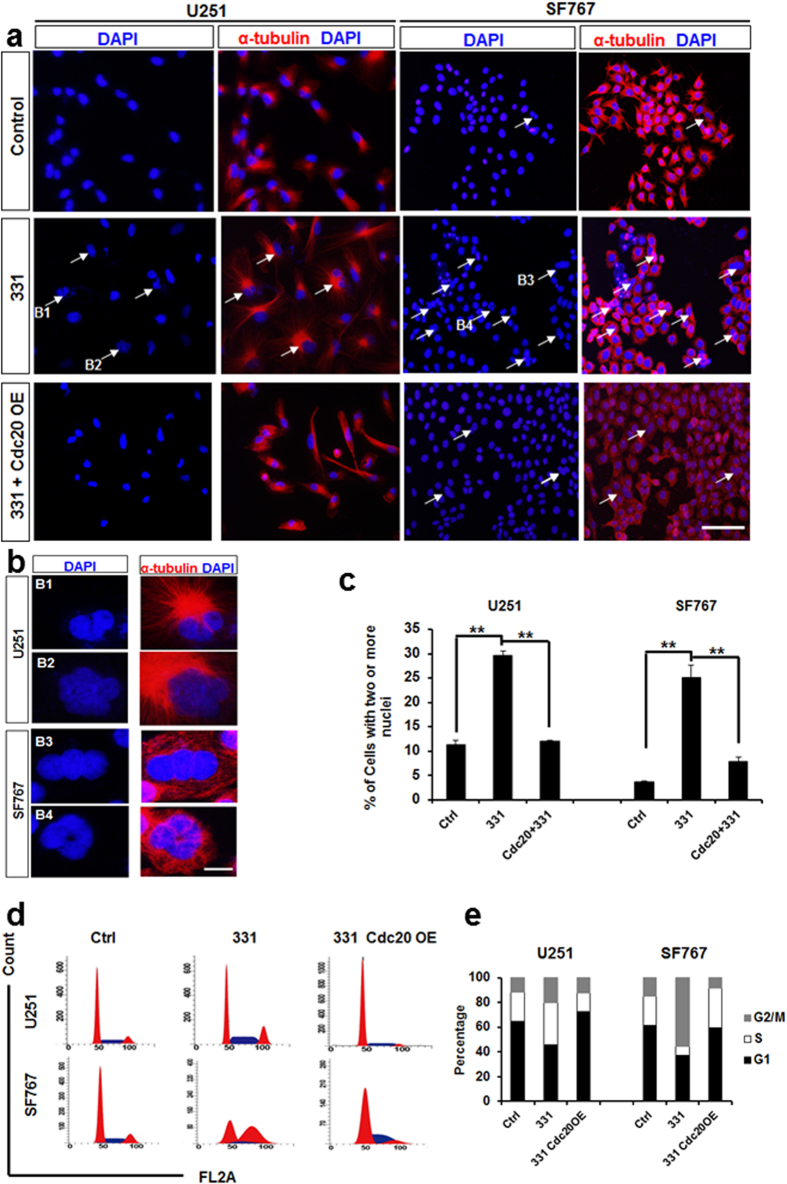
Figure 5. Compound 331 induced mitotic catastrophe in glioma cells.
(a) Representative micrograph images obtained from glioma cells treated with compound 331 (20 μM, 48 h) or transfection wtih CDC20 overexpression plasmid (24 h before treated with compound 331). The arrows indicate cells with two or more nuclei. The scale bar represents 200 μm. (b) High-magnification images of cells in a. The scale bar represents 20 μm. (c) Quantification of cells with two or more nuclei. The cells with two or more nuclei were counted in 5 random fields, and 100 cells were counted every field. Data represents the mean ± S.E.M. of three independent experiments. **p < 0.01. (d) Cell cycle analysis. Treatment with compound 331 (20 μM, 48 h) induced accumulation of cells in G2/M phase. (e) Quantification of cell cycle distribution (G1, S and G2/M) in glioma cells treated with compound 331 (20 μM, 48 h) or meanwhile transfected wtih CDC20 overexpressing plasmid (24 h before treated with compound 331).

