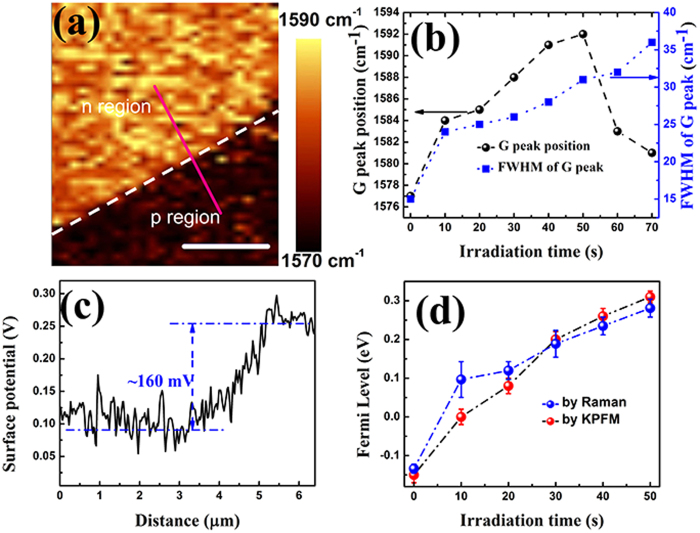
Figure 2. Characterizations of the shift of Fermi level after electron beam irradiation.
(a) G band mapping of the boundary of irradiated (with 30 seconds treatment) and un-irradiated graphene sample, and the white dash line is the boundary between the irradiated and the un-irradiated regions. The scar bar is 3 μm; (b) evolution of the G Raman band position and FWHM with different irradiation times; (c) Kelvin Probe Force Microscope (KPFM) profile of the graphene sample along the pink line in Fig. 2(a); (d) Fermi level evolution detected by KPFM and calculation from the G peak position.

