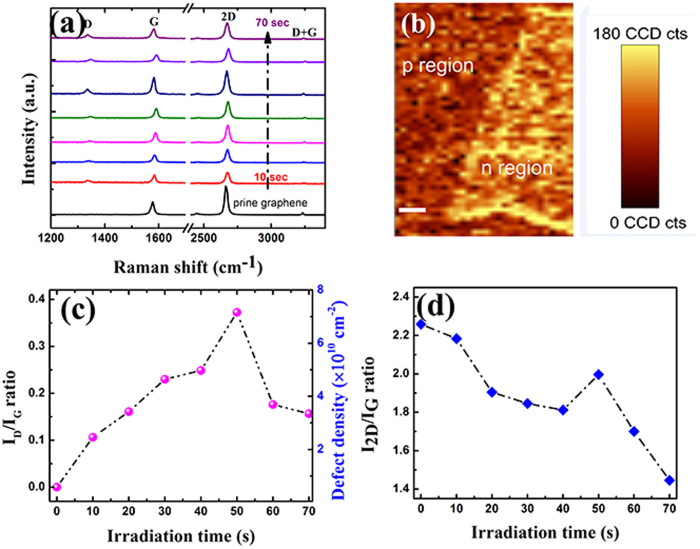
Figure 3. Characterization of defects and defect density by Raman spectroscopy.
(a) Raman spectra of graphene with different irradiation times from 10 seconds to 70 seconds; (b) D band mapping of the boundary of irradiated (with 30 seconds treatment) and un-irradiated regions in the graphene sample; (c) Intensity ratios of ID/IG and defect densities after different irradiation times; (d) Intensity ratios of I2D/IG after different irradiation times.

