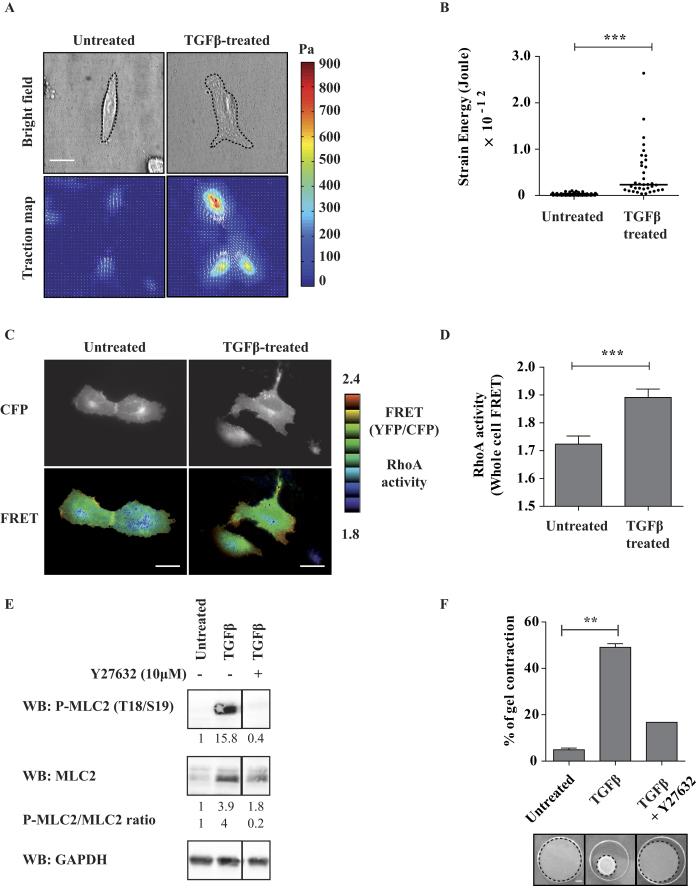
Figure 2. TGFβ1-induced EMT enhances actomyosin contractility and matrix remodelling.
(A) EMT promotes traction forces on the substratum. Representative phase contrast images and corresponding traction force maps of untreated and TGFβ-treated A549 cells as revealed by Traction Force Microscopy (TFM). Color scale bar denotes traction stress (Pa). Scale bar, 50 μm. (B) Quantification of the strain energy. TGFβ-treated cells generate significantly higher strain energies compared to untreated cells. Number of untreated cells n = 51, TGFβ-treated cells n = 35, from two experiments. (C) EMT stimulates Rho activity. Visualization of RhoA activity in representative untreated and TGFβ-treated cells. Cells were transfected with a plasmid expressing Raichu-RhoA (KRasCter) biosensor and observed by FRET microscopy the day after. Note the higher level of RhoA at cell periphery. Scale bars, 20 μm. (D) Quantification of whole-cell RhoA activity. YFP and CFP images were acquired for each cell and mean intensities were measured for the entire cell surface. The YFP/CFP ratio is a measure of whole-cell FRET, i.e. of whole-cell RhoA activity. Number of untreated cells n = 54, TGFβ-treated cells n = 41, from two experiments. (E) EMT induces MLC2 phosphorylation. The levels of total and phosphorylated MLC2 were analyzed by western-blot. The quantification of band intensities (with respect to untreated condition) and the calculated P-MLC/MLC ratio are indicated. The vertical lanes indicate positions were gel images were cut in order to juxtapose non-adjacent lanes coming from the same gel. (F) EMT stimulates ROCK-dependent actomyosin contractility. A549 cells were grown with or without TGF-β1 for 7 days and embedded in collagen I gels for 4 days. Gel contraction was monitored. Where indicated, cells were pre-treated for 2 hrs with 10 μM Y27632 ROCK inhibitor and submitted to collagen contraction assay in presence of the inhibitor. Number of untreated gels n = 2, TGFβ-treated gels n = 2, TGFβ/Y27632-treated gels n = 1, from two experiments. Error bars represent SEM. p values come from two-tailed Student’s t test. *p < 0.05, **p < 0.01, ***p < 0.001.Scale bar is 100 μm.

