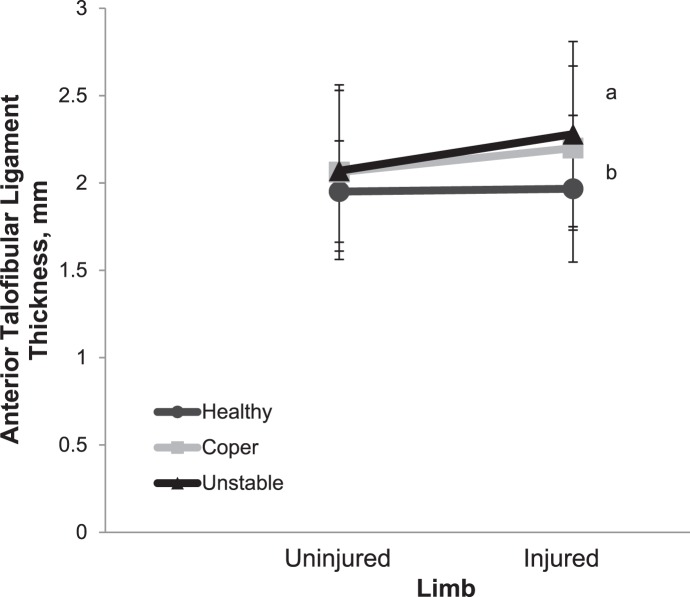
Figure 4.
Limb-by-group analysis showing interaction. a Indicates a difference between the “injured” limb of the healthy group and the injured limb of the unstable group (P = .015). b Indicates a difference between the “injured” limb of the healthy group and the injured limb of the coper group (P = .015).

