
Fig. 4.
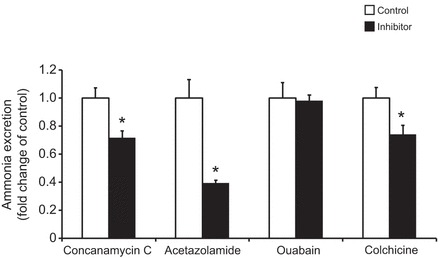
Effects of different inhibitors on ammonia excretion rates in C. elegans. Control values for each treatment were set to 1, with values measured under the influence of the inhibitors are given as ‘fold change’ of the respective control. The concentrations of the inhibitors were: concanamycin C, 5 µmol l−1 (N=5–6); acetazolamide, 5 mmol l−1 (N=5–6); ouabain, 5 mmol l−1 (N=6); colchicine, 2 mmol l−1 (N=5–6). Data represent means±s.e.m. and were analyzed employing an unpaired, two-tailed Student's t-test prior to calculation for fold change values. *P≤0.05.