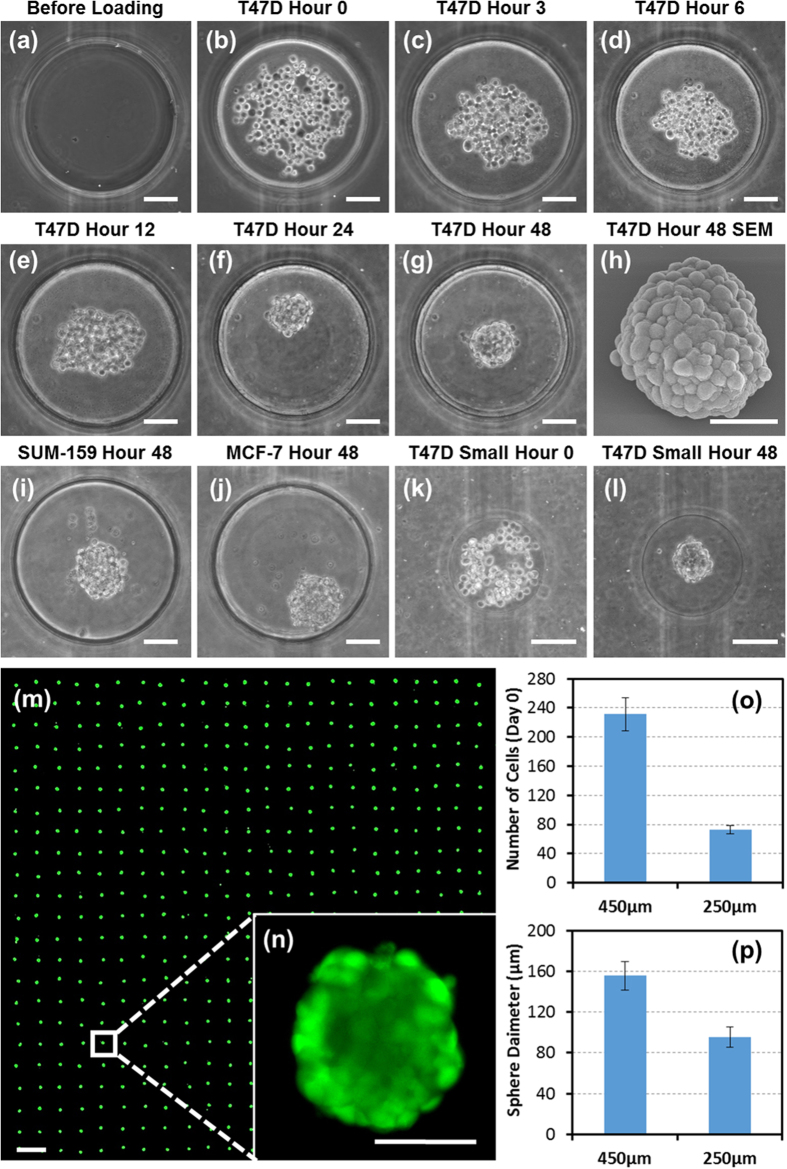
Figure 3. Characterization of sphere formation on chip.
(a-g) Sphere formation of T47D breast cancer cells in a large microwell: (a) before cell loading, (b) right after cell loading, (c) 3 hours, (d) 6 hours, (e) 12 hours, (f) 24 hours, and (g) 48 hours after cell loading. (scale bar: 100 μm) (h) SEM image of a sphere retrieved from the chip after 48 hour culture. (scale bar: 50 μm) (i) A sphere formed by SUM-159 breast cancer cells after 48 hours. (scale bar: 100 μm) (j) A sphere formed by MCF-7 breast cancer cells after 48 hours. (scale bar: 100 μm) (k–l) Sphere formation of T47D breast cancer cells in a small microwell: (k) right after cell loading and (l) 48 hours after cell loading. (scale bar: 100 μm) (m) An array of spheres formed in the device. The spheres were stained with green Cell Tracker. (scale bar: 1 mm) (n) An enlarged view of a sphere in a microwell. (scale bar: 100 μm) (o) Average number of cells loaded in the large and small microwells. (N = 20 micro-wells) (p) Average diameter of spheres in the large and small microwells. (N = 20 spheres).

