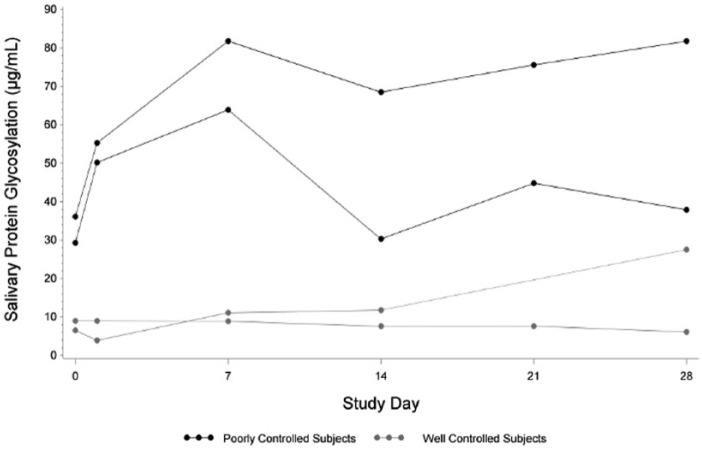
Figure 2.
Salivary protein glycosylation in subjects over time. Weekly salivary protein glycosylation was plotted against study day for 2 representative subjects with well-controlled glycemia and 2 representative subjects with poorly controlled glycemia (classified as described in the main text). Salivary protein glycosylation levels are expressed as μg/ml of bovine fetuin equivalents.

