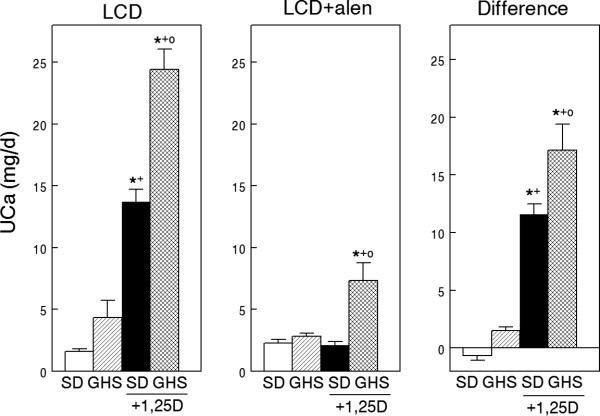
Figure 3. Urine calcium excretion in SD and GHS rats fed low calcium diet (LCD), without or with exogenous 1,25D, before and during alendronate (alen).

Left panel, LCD diet. Middle panel, LCD diet with alen injection. Right panel, difference (right panel) calculated as (uCa before alen) – (uCa after alen). Data expressed as mean±SEM. Significance was measured within groups. *, p<0.05 compared to SD; +, p<0.05 compared to GHS; o, p<0.05 compared to SD+1,25D. From (59*)
