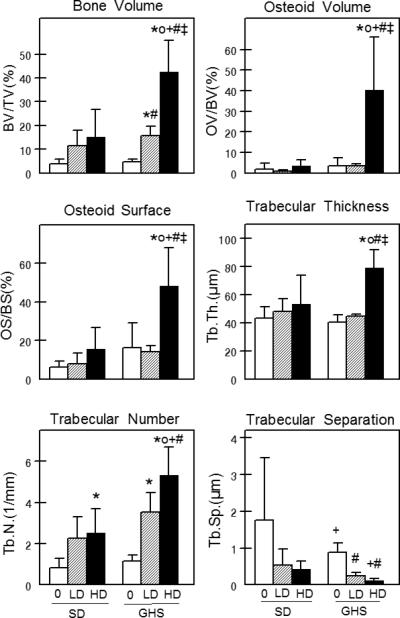
Figure 5. Trabecular bone structure.

Static histomorphometry was performed on proximal left tibiae from SD and GHS rats. % bone volume, % osteoid volume, % osteoid surface, trabecular thickness, trabecular number and trabecular separation were determined. All data are presented as mean ± standard deviation. * p<0.05 compared to SD+veh; o p<0.05 compared to SD+LD; + p<0.05 compared to SD+HD; # p<0.05 compared to GHS+veh; ‡ p< 0.05 compared to GHS+LD. From (60*)
