Abstract
Current generation of commercial time-of-flight (TOF) PET scanners utilize 20–25 mm thick LSO or LYSO crystals and have an axial FOV (AFOV) in the range of 16–22 mm. Longer AFOV scanners would provide increased intrinsic sensitivity and require fewer bed positions for whole-body imaging. Recent simulation work has investigated the sensitivity gains that can be achieved with these long AFOV scanners, and has motivated new areas of investigation such as imaging with very low dose of injected activity as well as providing whole-body dynamic imaging capability in one bed position. In this simulation work we model a 72 cm long scanner and prioritize the detector design choices in terms of timing resolution, crystal size (spatial resolution), crystal thickness (detector sensitivity), and depth-of-interaction (DOI) measurement capability. The generated list data are reconstructed with a list-mode OSEM algorithm using a Gaussian TOF kernel that depends on the timing resolution and blob basis functions for regularization. We use lesion phantoms and clinically relevant metrics for lesion detectability and contrast measurement. The scan time was fixed at 10 minutes for imaging a 100 cm long object assuming a 50% overlap between adjacent bed positions. Results show that a 72 cm long scanner can provide a factor of ten reduction in injected activity compared to an identical 18 cm long scanner to get equivalent lesion detectability. While improved timing resolution leads to further gains, using 3 mm (as opposed to 4 mm) wide crystals does not show any significant benefits for lesion detectability. A detector providing 2-level DOI information with equal crystal thickness also does not show significant gains. Finally, a 15 mm thick crystal leads to lower lesion detectability than a 20 mm thick crystal when keeping all other detector parameters (crystal width, timing resolution, and DOI capability) the same. However, improved timing performance with 15 mm thick crystals can provide similar or better performance than that achieved by a detector using 20 mm thick crystals.
1. Introduction
Current generation whole-body, time-of-flight (TOF) PET scanners are typically 16–22 cm long axially, achieve 4–5 mm spatial resolution using 4 mm wide LSO or LYSO crystals, and have a coincidence timing resolution in the range of 500–600ps (Surti et al., 2007, Jakoby et al., 2011, Bettinardi et al., 2011). To achieve high sensitivity the crystal thickness is between 20–25 mm and no depth-of-interaction (DOI) measurement capability is available. These design choices have been made primarily as a trade-off between performance needs for routine oncologic 18F-FDG imaging and cost.
In recent years (Cherry, 2006) there has been an interest in developing whole-body PET scanners with much longer axial field-of-view (AFOV) that not only increase the system sensitivity but also allow imaging more (if not all) of the patient in a single bed position. Some of the motivations for these designs are: further reduction in routine clinical scan times which can be beneficial in reducing patient motion artifacts or allowing respiratory gating, performing whole-body dynamic imaging for pharmacokinetic studies, and performing very low dose imaging studies that open up areas in pediatric imaging and serial monitoring of patients for disease response to therapy.
Several Monte Carlo simulation studies to evaluate longer AFOV scanners have focused mainly on the increased scanner sensitivity and noise equivalent counts (NEC) (Badawi et al., 2000, Eriksson et al., 2007, Hunter et al., 2009, MacDonald et al., 2011, Eriksson et al., 2011, Poon et al., 2012). In addition to simulation studies, there have also been prototype developments of two scanners with axial FOV that is much longer than that available commercially. The first design was by a Japanese group using BGO crystals to develop a scanner with 68.5 cm axial length (Watanabe et al., 2004), while the second design was by Siemens using LSO crystals in scanner with axial length of 53 cm (Conti et al., 2006). Neither of these systems was TOF-capable and, hence, the imaging gains achieved by these systems were primarily from the increased intrinsic sensitivity of the device. While the BGO design is cost-effective it also carries the inherent limitations of BGO not being an ideal scintillator for fully-3D PET due to its limited energy resolution (Muehllehner et al., 2002), and not capable of TOF imaging due to its poor timing resolution.
There are currently at least two groups actively investigating scanner designs that are 2 m long. The EXPLORER group (EXPLORER.ucdavis.edu) is developing a high performance system using a conventional (LSO/LYSO) scintillator based detector (Poon et al., 2012). Alternately, considering the cost of the LSO/LYSO scintillator, another group is evaluating the use of costeffective, resistive plate chamber (RPC) technology (Crespo et al., 2012) that can potentially provide very high system performance – good spatial and timing resolution as well as DOI capability.
In a previous study (Surti et al., 2013b) we investigated the potential to achieve higher performance in a whole-body PET scanner by using a fixed volume of crystal (similar to that used in current commercial PET scanners); making the LSO crystals shorter while increasing the scanner AFOV, effectively trading the crystal stopping efficiency for the scanner geometric sensitivity. Our simulation studies showed that the best imaging performance, as determined by the area under the localization receiver operating characteristic curve (ALROC), is achieved when using 10 and 5 mm thick crystals and increasing the scanner AFOV to 36 and 72 cm respectively. This improvement is primarily due to a better optimization of system sensitivity as well as improved spatial resolution and reduced parallax error for short crystals. While both the 36 and 72 cm long scanners performed similarly in this study, the 72 cm long scanner also presents the potential to perform whole-body dynamic imaging in a cost-effective design.
In another study (Shore et al., 2012, Surti et al., 2013a) we studied the impact of spatial and timing resolution and a 2-level DOI information on the ALROC performance of an 18 cm long scanner. Our results in that evaluation showed that both spatial and timing resolution lead to improved ALROC performance while the 2-level DOI information shows a bigger benefit when using smaller crystals (2.6 mm wide versus 4 mm wide) due to improved spatial resolution. These conclusions were verified in a separate study by Thoen et al. (Thoen et al., 2013) using a non-prewhitening matched filter signal-to-noise ratio (NPW SNR) metric for a signal-known-exactly background-known-exactly (SKE/BKE) lesion detection task.
In this study our goal is to explore the impact of detector performance (crystal size, thickness, DOI capability, and timing resolution) on the design of a long AFOV PET scanner. As opposed to previous studies (Surti et al., 2013a, Surti et al., 2013b, Thoen et al., 2013), here we focus on imaging at low activity levels which may be of interest in pediatric imaging or for performing serial PET scans for therapy monitoring. Hence we explore imaging at activity levels as low as 1/20th of that typically injected for routine 18F-FDG scans currently (15 mCi). The scanner AFOV is fixed at 72 cm based on the results of our past work (Surti et al., 2013b), and we primarily use the ALROC metric as the primary figure of merit. The cost of scintillator and photo-detector does not explicitly enter into our evaluations.
2. Methods
2.1. Simulated scanner geometry
We performed EGS4-based system simulations (Surti et al., 2004) for a cylindrical PET scanner geometry using pixelated LSO crystals. Scanner ring diameter was fixed at 85 cm while the AFOV was 72 cm. Lead end shields were modeled for the scanners leading to a patient port diameter of 65 cm. Variable detector parameters were: crystal width (3 and 4 mm wide), crystal thickness (15 and 20 mm), DOI capability (without DOI and a 2-level DOI with crystal split into two layers of equal thickness), and timing resolution (300, 450, and 600ps). Crystal pitch was modeled as 3.3 mm and 4.3 mm for the two crystal widths, with the 0.3 mm gap between adjacent crystals representing the reflector. The gap between adjacent crystals is typical of detector systems using some powder-based reflector (Daube-Witherspoon et al., 2010), but is larger than the 0.07 mm gap which is typical of scanners using thin reflective films (Surti et al., 2007). The choice of timing resolution values used here covers the range of current commercial systems using LSO or LYSO as a scintillator and using both PMTs and silicon photomultipliers (SiPMs) (Surti et al., 2007, Jakoby et al., 2011, Bettinardi et al., 2011, Levin et al., 2014, Miller et al., 2014). The choice of 4 mm wide crystals represents the crystal size currently used in whole-body PET, while the 20 mm thickness represents the mid-point of 15–25 mm long crystals typically being used commercially. Using 3 mm wide crystals represents potential for improved spatial resolution, while 15 mm long crystals represents the potential for improved timing resolution and somewhat reduced system cost. For comparison we also simulated a scanner with 18 cm AFOV, 4 mm wide and 20 mm long crystals, and 600ps timing resolution – representing a design somewhat analogous to an existing commercial PET scanner (Surti et al., 2007). For all scanner designs the energy resolution was set at 12% while the lower energy threshold was fixed at 440 keV, both of which represent typical values in LSO or LYSO based whole-body PET scanners. For each annihilation event, the Monte Carlo simulation tracks the 511 keV photons through the phantom and the PET detector. Primary modes of interaction are Compton and photoelectric in the phantom as well as the pixelated LSO detector. In previous work we have shown reconstructed spatial resolution for two PET systems (Surti et al., 2004) that agree well with experimental measurements on similar scanners (Surti et al., 2007, Daube-Witherspoon et al., 2010).
2.2. Simulated phantoms
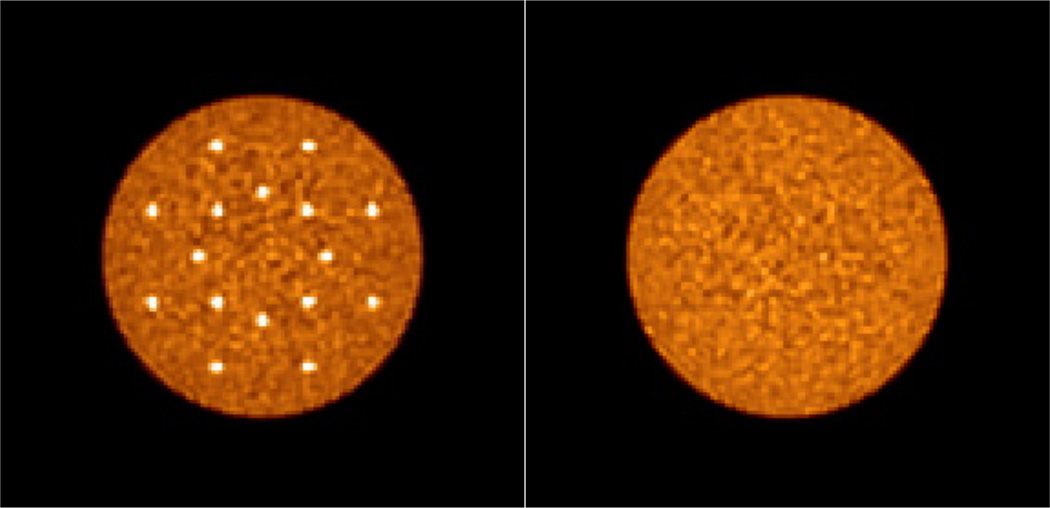
We simulated cylindrical lesion and uniform phantoms (35 cm diameter by 70 cm long) similar to those used in our previous study (Surti et al., 2013b). The 35 cm diameter phantom has been shown to be a reference for heavy patients (BMI ~ 31) (Surti et al., 2007). Only true and scatter coincidences were simulated. The lesion phantom had 16, 1 cm diameter hot lesions (spheres) placed in the central transverse slice with a water background. The lesion activity uptake ratio was set at 3:1 relative to the background. Lesion diameter of 1 cm was chosen because it represents the smallest lesion we typically evaluate for scanner performance characteristics and is loosely based on the premise that this lesion size represents a challenging measurement for scanners with spatial resolution in the range of 4–5 mm. Detection of 1 cm lesions with 3:1 activity uptake relative to background results in a contrast recovery of 30–40%, and hence will be challenging for a detection task in a realistic noise background. Eight lesions were uniformly distributed at a radial position of 7 cm from the center, while the other eight were uniformly distributed at a radial position of 13 cm from the center to capture the impact of parallax error. The uniform water-filled phantom had an activity concentration that is the same as the lesion phantom background. Five independent data replicates were simulated for each phantom. In figure 1 we show reconstructed images of the central transverse slice for these two phantom simulations with very high count statistics (or scan time) in order to illustrate the distribution of lesions.
Figure 1.
Reconstructed images of the central transverse slices for the simulated lesion (Left) and uniform (Right) phantoms. Images are shown for data reconstructed with very high count statistics (or scan time). The distribution of 16, 1-cm diameter lesions at radial distances of 7 and 13 cm can be visualized in the Left image.
2.3. Simulated activity concentration, scan time, and image reconstruction
For our studies we varied the background activity concentration within a range of 0.005–0.1 µCi/cc to better model imaging scenarios over a wide span of injected radiotracer levels. For comparison, currently a routine 18F-FDG patient scan has a typical background activity concentration of 0.1 µCi/cc after a 15 mCi injection and a 60 minutes uptake period. For this activity level, the current standard clinical protocol at our institution for imaging on the Gemini TF is 90, 120, and 180 seconds per bed position for patients with low (< 25), medium (25–30), and high (> 30) BMI, respectively.
In this simulation study, we fixed the total scan time at 10 minutes for imaging a 100 cm long object. This is in agreement with typical whole-body scan times in the clinic with modern TOF PET scanners, and we reasoned that future wide scale adaptation of a long AFOV scanner in the clinic will at a minimum not increase the total imaging time. After accounting for the number of overlapping bed positions needed to cover a 100 cm object (assuming a 50% overlap), this translates into single bed position scan times of 160s and 50s for scanners with AFOV of 72 cm and 18 cm, respectively.
The simulation output is a list-mode data set that is reconstructed using blob-basis functions (Matej and Lewitt, 1996) and a list-mode OSEM algorithm with Gaussian TOF kernel, 25 subsets, and normalization, attenuation, and scatter corrections built into the system model (Popescu, 2004). The endpoints for each LOR are given by the physical location of the crystals (ϕ and z coordinates in a cylindrical coordinate system) where the two annihilation photons are determined to interact. The radial position of the LOR is at the entrance surface of the crystal for the detector without DOI information. For the 2-level DOI detector the LOR radial position is at the entrance surface or half way through the crystal thickness for interactions determined to be in layer 1 or 2, respectively.
The blob basis functions are on a body-centered cubic grid with an optimized blob spacing of 6 mm and 4 mm (blob radius of 7.5 mm and 5.0 mm) for scanner designs using 4 mm and 3 mm wide crystals, respectively. This choice of blob parameters leads to blob widths that are appropriate for the two crystal sizes (and hence spatial resolution) used in this study (Matej and Lewitt, 1996). The reconstructed blob image is finally converted into 2 × 2 × 2 mm3 image voxels by summing the magnitude and intensity of each blob at a given image voxel center. Note that the noise characteristics of the image are determined only by the blob parameters while the 2 × 2 × 2 mm3 image voxels provide adequate sampling of the image space to determine lesion uptake. No point spread function (PSF) modeling was performed in the image reconstruction for this study. Attenuation images were generated analytically, and scatter estimate was obtained using a TOF-extended single scatter simulation correction (Werner et al., 2006) that is similar in principle to the methods implemented commercially by Philips and Siemens. Normalization data were generated by performing uniform phantom simulations (40 cm diameter and same length as the scanner AFOV) for each scanner design with a very high number of coincident events. Similar normalization techniques used clinically utilize a small diameter phantom due to the practical constraints of collecting enough coincident events from decaying activity after attenuation in the phantom in a reasonable amount of scan time. Since simulations are not limited by these practical constraints, we used a normalization phantom that is larger in size than the simulated lesion phantom, and hence requires no extrapolations in the generating the normalization data. All data were used for image reconstruction without setting an upper limit for the maximum ring difference (MRD).
2.4. Image analysis
Lesion detectability was estimated using a generalized scan statistics model (Popescu and Lewitt, 2006). Briefly, we calculate the local contrast over multiple lesions in the lesion phantom images (5 image replicates × 16 lesions per image = 80 lesions) by using the ratio of mean counts in a circular ROI (diameter of 1 cm) and the mean counts in an annulus around the circular ROI (inner diameter of 1.2 cm, outer diameter of 4 cm). The lesion contrast distribution was fitted to a Gaussian to estimate the lesion contrast (or signal) probability density function (pdf). Local contrast distribution for noise nodules was calculated by scanning the uniform cylinder images (five image replicates), and calculating the contrast for ROIs centered over each image voxel. A Gaussian fit to the tails of the local contrast distribution for noise nodules is then used to estimate the pdf of the noise nodule contrast as described in (Popescu and Lewitt, 2006). The two (signal and noise) pdfs are used to calculate the localization receiver operating characteristic (LROC) curve (Swensson, 1996) from first principles. For our analysis we chose to calculate the area under the LROC curve (ALROC) as the metric for lesion detection and localization since the primary difference in our different scanner designs is count statistics. ALROC values were calculated for the different scanner geometries and timing resolutions a function of the number of reconstruction iterations. The error in the ALROC value was determined as the standard deviation of the results over 100 bootstrap data sets. The ALROC value changes as a function of the number of iterations of the reconstruction algorithm, and the maximum ALROC value is reached faster as the timing resolution improves in TOF scanners. The local lesion contrast value averaged over all lesions (16 per images × 5 replicate images) and its relative standard deviation were also used as measures of accuracy and precision for lesion uptake measurement. All results shown here (ALROC as well as Contrast) are for the iteration number at which the maximum ALROC value is achieved for a given scanner design (iteration numbers 2, 2, 3, and 6 respectively for scanners with timing resolution of 300ps 450ps, 600ps, and Non-TOF, and independent of any other design parameters).
3. Results
3.1. Impact of scanner AFOV and crystal thickness
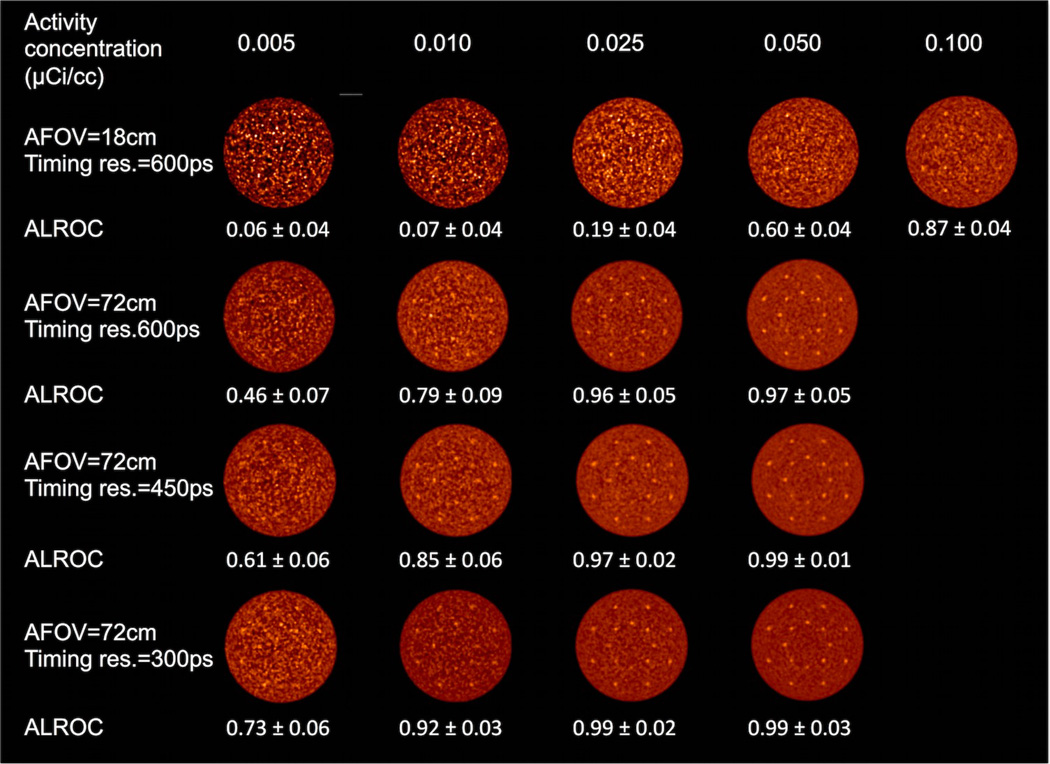
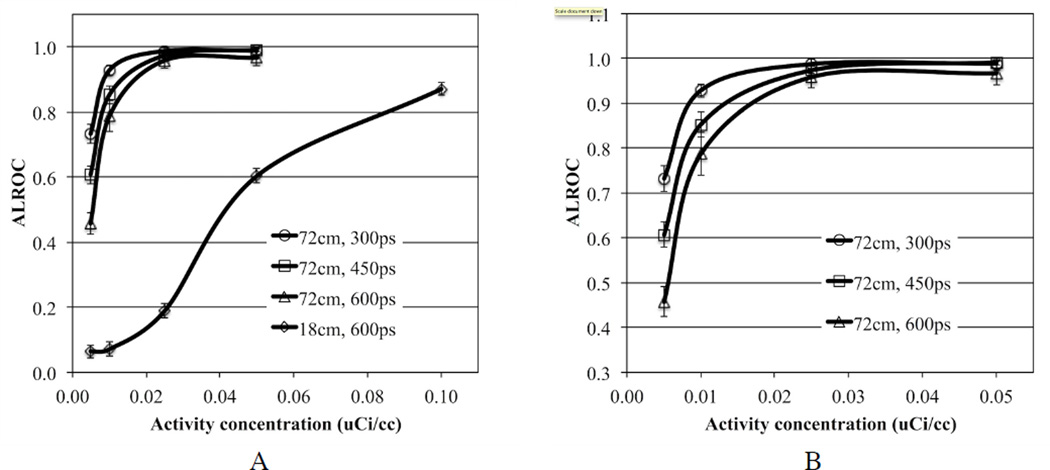
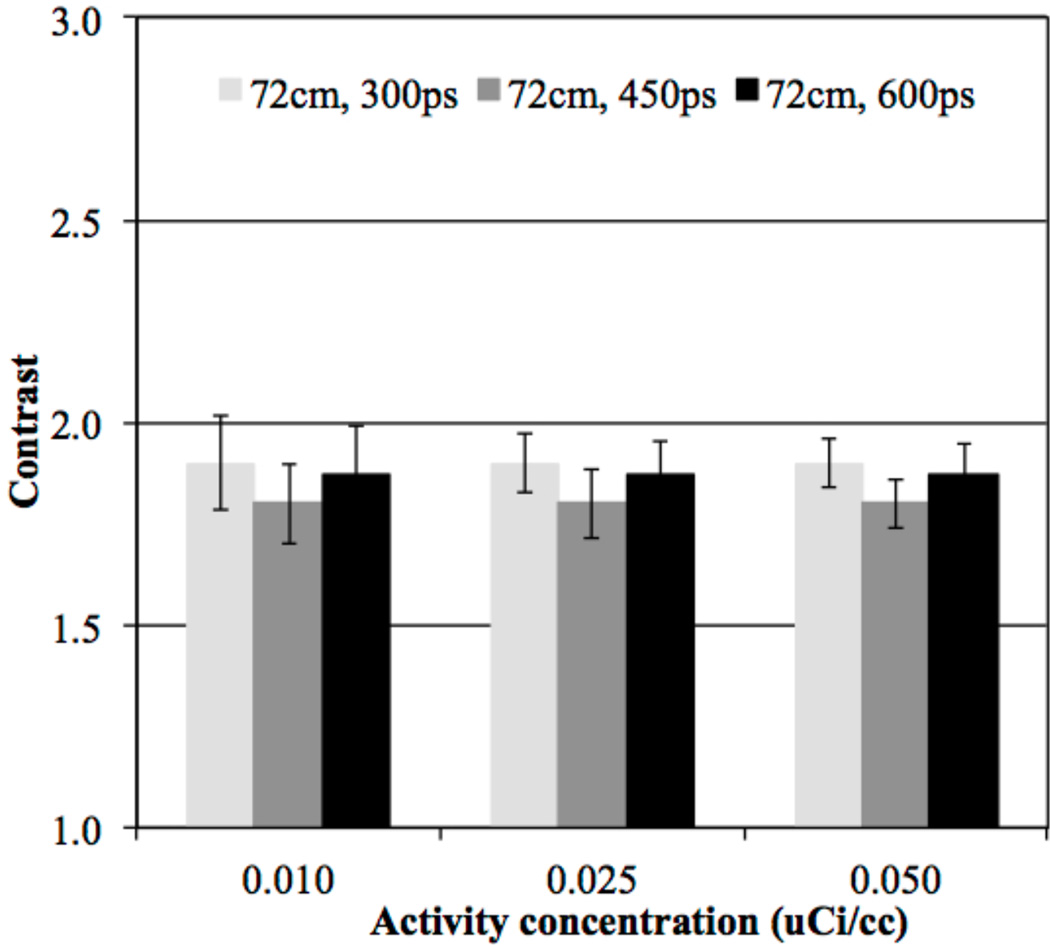
In figure 2 we show central transverse slices from reconstructed images of the lesion phantom for the 72 cm AFOV scanner as a function of activity concentration and for varying timing resolution. For comparison we also show images from a scanner with 18 cm AFOV and 600ps timing resolution (“traditional design”). Qualitatively from these images we see that for the traditional scanner design the lesions are visible at 0.1 µCi/cc, but at lower activity concentration the image is too noisy for good lesion detection. Keeping the timing resolution fixed at 600ps but making the scanner 72 cm long there is good lesion visibility for activity concentration in the range of 0.01–0.025 µCi/cc. With improved timing resolution the activity concentration can be further reduced to maintain good lesion detection. In figure 3 we show the ALROC results as a function of activity concentration. Using an ALROC value of 0.6–0.8 as cutoff we find that with a 72 cm AFOV scanner the injected activity can be reduced by about a factor of ten. While the choice of ALROC in the range of 0.6–0.8 as a cutoff value may appear subjective, a quick visual evaluation of the representative images in figure 3 shows that these numerically calculated values of ALROC agree well with visual detection and localization of the lesions. Improvements from better timing resolution are most apparent at very low activity levels (≤ 0.01 µCi/cc). In figure 4 we show the average lesion contrast as a function of low activity levels for scanners with 72 cm AFOV (for iteration numbers where ALROC is maximized). The lesion contrast value does not deviate significantly at these activity levels and indicates that noise in the image is the primary factor affecting the ALROC results. The small variation in contrast with timing resolution is due to the choice of iteration number where ALROC maximizes, iteration number 2 for 300ps and 450ps timing resolution and iteration 3 for 600ps. The slightly lower CRC value for 450ps data compared to 300ps data is due to the use of same iteration number (2) where the ALROC maximizes but the CRC convergence is slower for the 450ps data. For the 600ps data we use a higher iteration number (3) where the ALROC maximizes and hence the CRC is just slightly higher than that shown for the 450ps data. The standard deviation of the contrast increases as the activity concentration is reduced but is in the 12–13% range at 0.01 µCi/cc.
Figure 2.
Reconstructed images of the central transverse slice from the lesion phantom. Images are from a single data replicate and are shown for varying activity concentration (columns), and combination of AFOV and timing resolution. The lesions are 1 cm in diameter with 3:1 uptake relative to the background.
Figure 3.
(A) ALROC results for all spheres in scanners with varying AFOV and timing resolution. Results are shown for scanners using 4×4×20 mm3 LYSO crystals without DOI information. The total scan time is equivalent to 10 minutes for imaging a 100 cm long patient or object. (B) Expanded view showing results only from scanners with 72 cm AFOV.
Figure 4.
Average contrast results for all spheres (16 spheres per image times 5 images) in scanners with 72 cm AFOV and varying timing resolution. Results are shown for scanners using 4×4×20 mm3 LYSO crystals without DOI information and at the iteration numbers where maximum ALROC is achieved. The total scan time is equivalent to 10 minutes for imaging a 100 cm long patient or object. The error bars are ± 0.5 standard deviation of contrast over all 80 spheres.
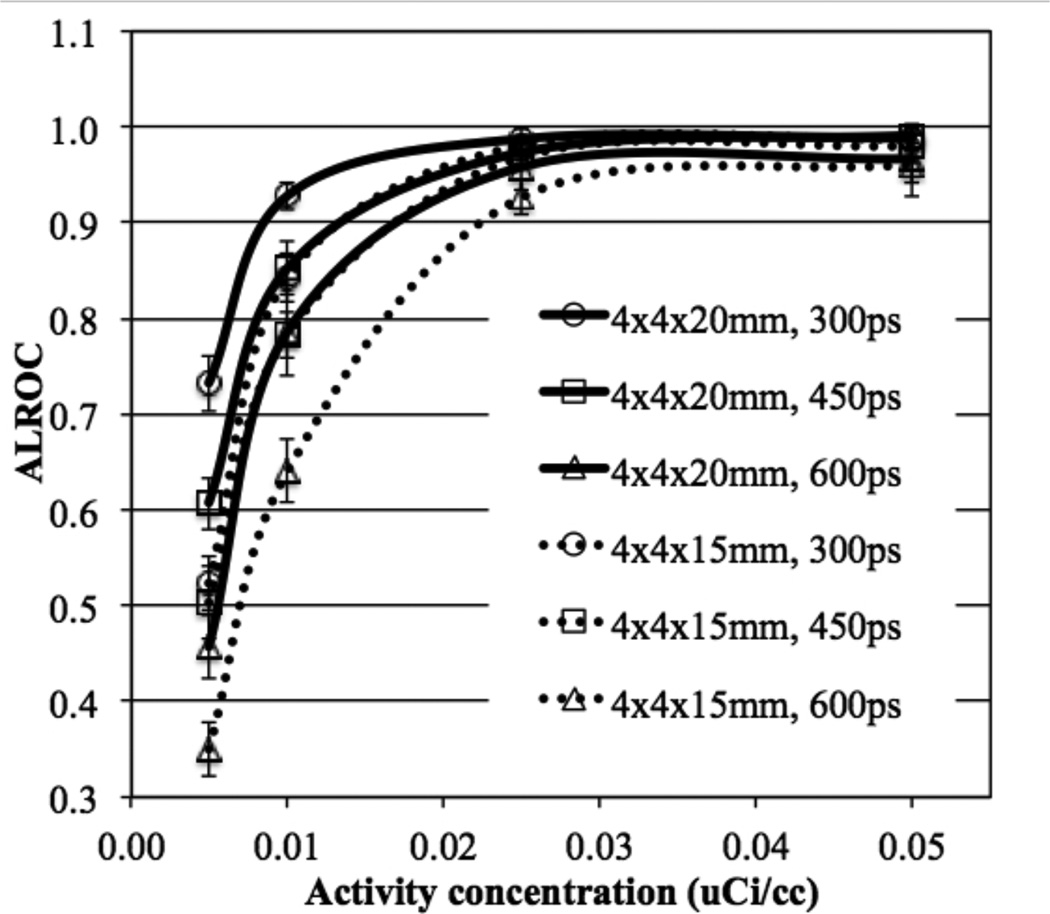
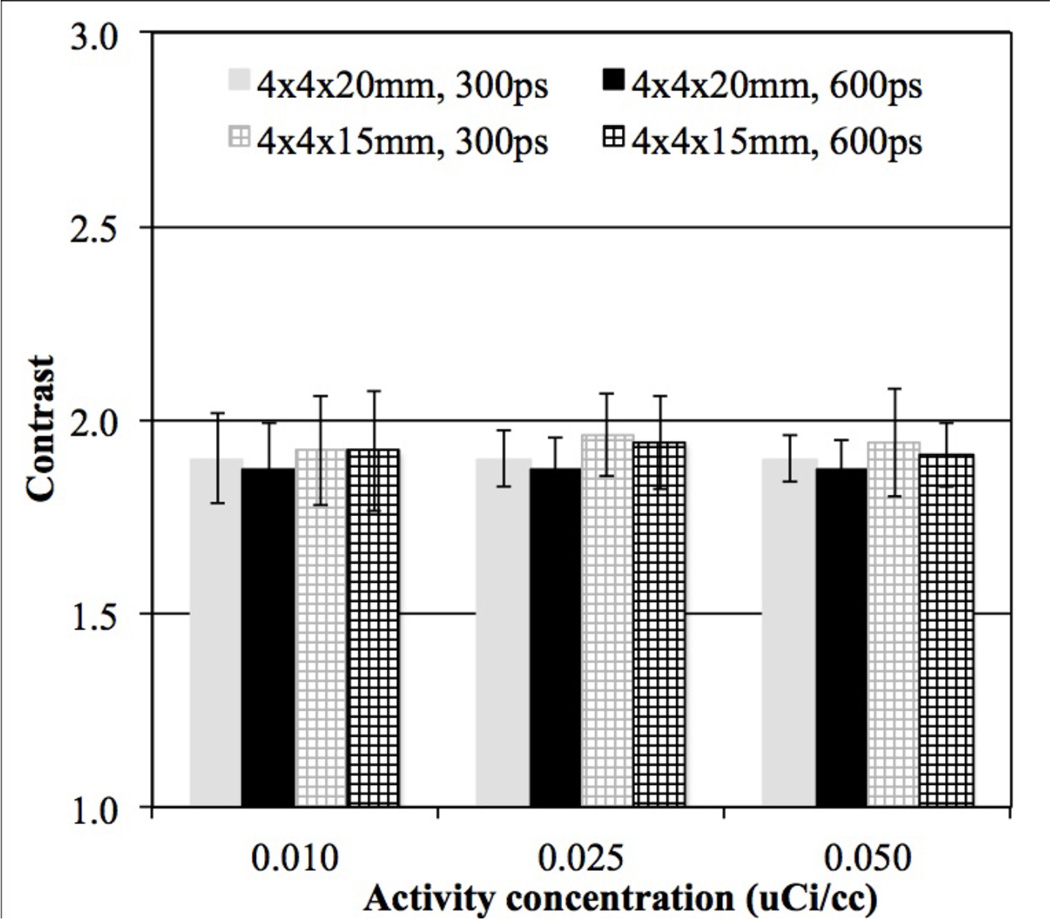
In figure 5 we plot the ALROC values as a function of activity concentration for 72 cm long scanners with two different crystal thickness (15 and 20 mm) and varying timing resolutions. While at activity concentrations ≥ 0.025 µCi/cc there is not a significant difference in performance due to crystal thickness (primarily due to very high ALROC values), at lower activity levels the increased sensitivity due to thicker crystals (20 mm) leads to gains in the scanner ALROC performance. Also, the performance of 15 mm thick crystal with 300ps and 450ps timing resolution is similar to the performance of 20 mm thick crystal with 450ps and 600ps timing resolution respectively. The intrinsic coincidence sensitivity gain when using 20 mm thick crystals is about 33% over 15 mm thick crystals. The effective gain in sensitivity due to improved timing resolution is 50% and 33% when comparing 300ps with 450ps and 450ps with 600ps, respectively. Hence, our results our consistent with expected changes due to system sensitivity and image noise. For the iteration number where maximum ALROC is achieved, the mean contrast also does not change significantly as a function of crystal thickness though the relative standard deviation of the contrast measurement is higher for the 15 mm thick crystals (figure 6).
Figure 5.
ALROC results for all spheres as a function of activity concentration for scanners with varying crystal length and timing resolution. Results are shown for scanners using 4 mm wide LYSO crystals, without DOI information, and a scanner AFOV of 72 cm. The total scan time is equivalent to 10 minutes for imaging a 100 cm long patient or object.
Figure 6.
Average contrast results for all spheres (16 spheres per image times 5 images) as a function of low activity concentration for scanners with varying crystal length and timing resolution. Results are shown at the iteration numbers where maximum ALROC is achieved for 72 cm long scanners using 4 mm wide LYSO crystals, and without DOI information. For clarity we only show results for 300ps and 600ps timing resolution. The total scan time is equivalent to 10 minutes for imaging a 100 cm long patient or object. The error bars are ± 0.5 standard deviation of contrast over all 80 spheres.
3.2. Impact of crystal width and DOI measurement
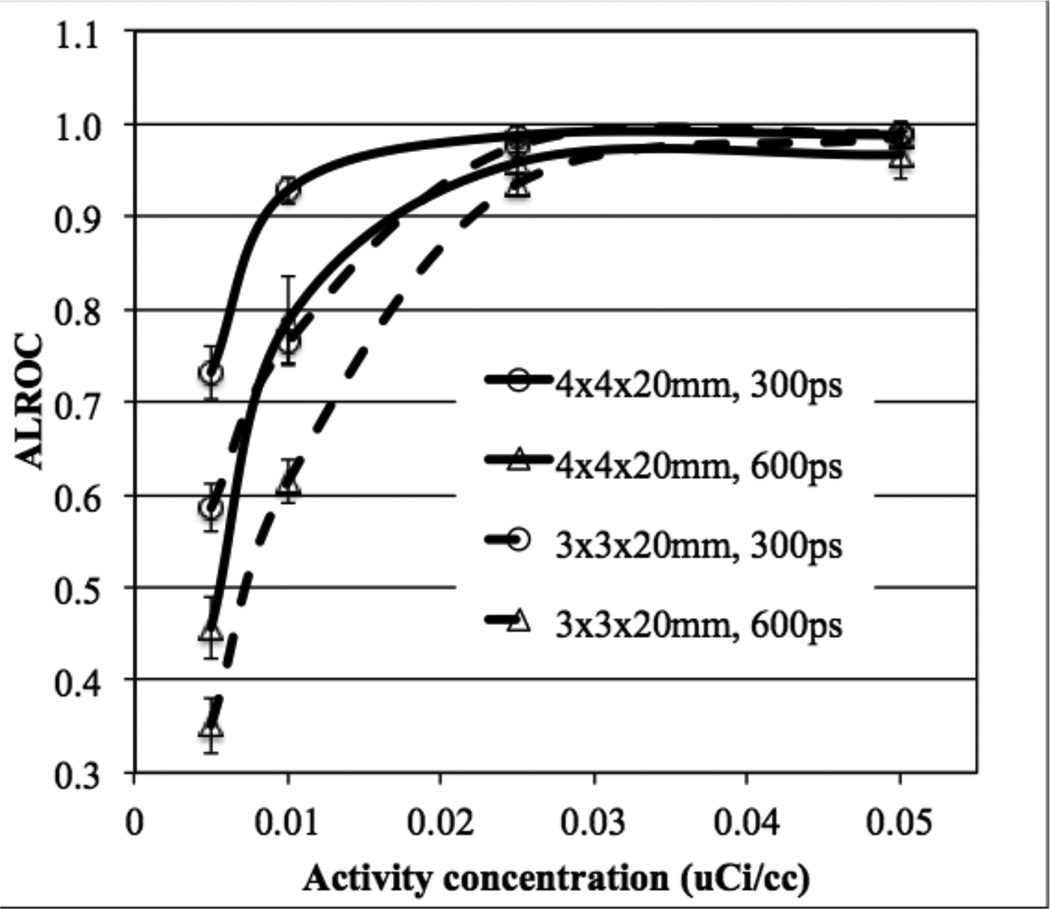
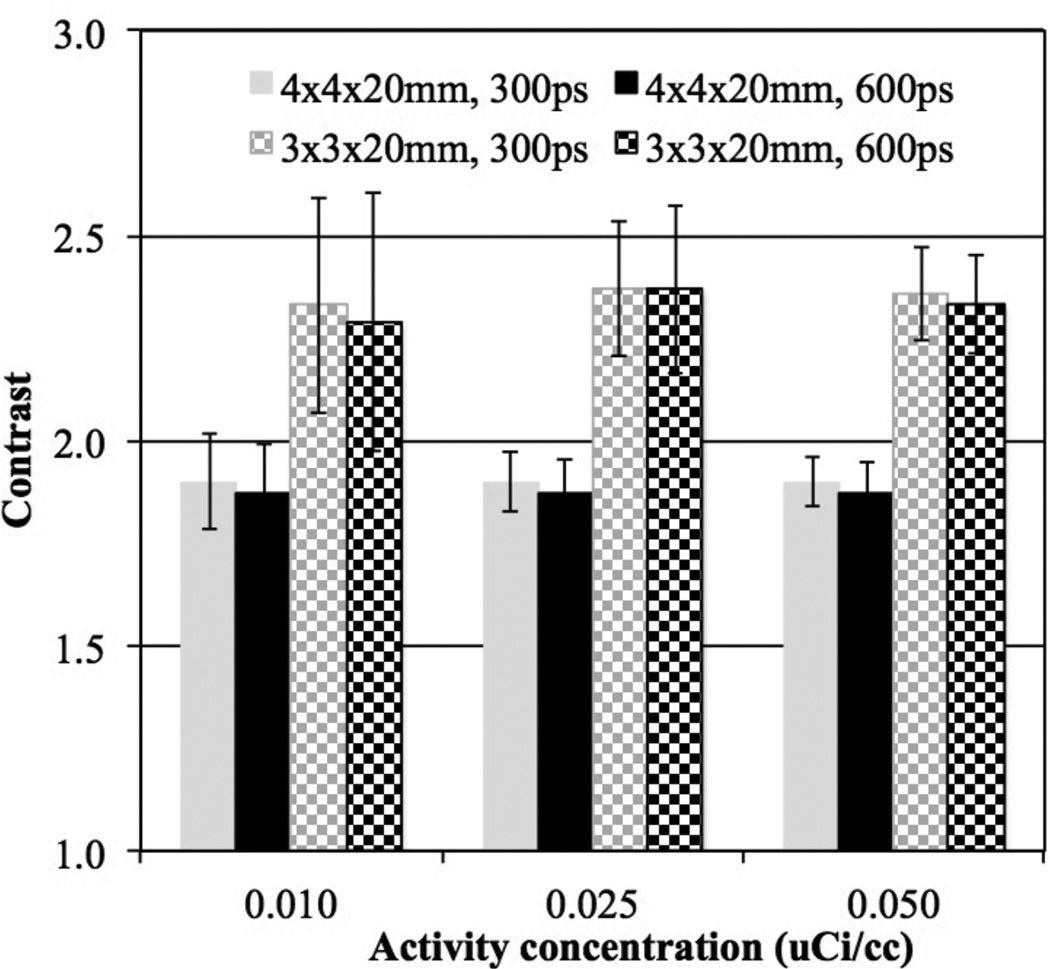
In figure 7 we plot ALROC as a function of activity concentration for scanners with two different crystal widths and timing resolution. At higher activity concentrations (≥ 0.025 µCi/cc) the ALROC values are similar and close to saturation (0.9–1.0). At lower activity concentrations, the ALROC is higher with the bigger (4 mm wide) crystals. In figure 8 we show the average lesion contrast as a function of low activity levels for the same scanner designs as shown in figure 7 (for iteration numbers where ALROC is maximized). There is a noticeable gain in contrast measurement with the 3 mm wide crystals due to the expected improvement in spatial resolution. However, the statistical noise in the image as determined by collected counts offsets the gain in contrast, leading to lower ALROC with the 3 mm wide crystals as shown in figure 7.
Figure 7.
ALROC results for all spheres as a function of activity concentration for scanners with varying crystal width and timing resolution. Results are shown for scanners using 20 mm LYSO crystals without DOI information, and a scanner AFOV of 72 cm. The total scan time is equivalent to 10 minutes for imaging a 100 cm long patient or object.
Figure 8.
Average contrast results for all spheres (16 spheres per image times 5 images) as a function of low activity concentration for scanners with varying crystal width and timing resolution. Results are shown for 72 cm long scanners using 20 mm long LYSO crystals without DOI information at the iteration numbers where maximum ALROC is achieved. The total scan time is equivalent to 10 minutes for imaging a 100 cm long patient or object. The error bars are ± 0.5 standard deviation of contrast over all 80 spheres.
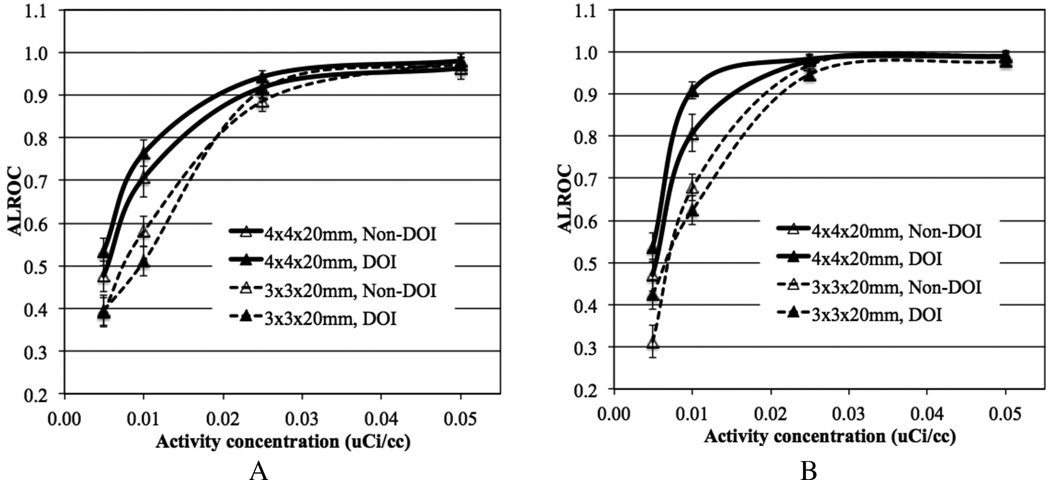
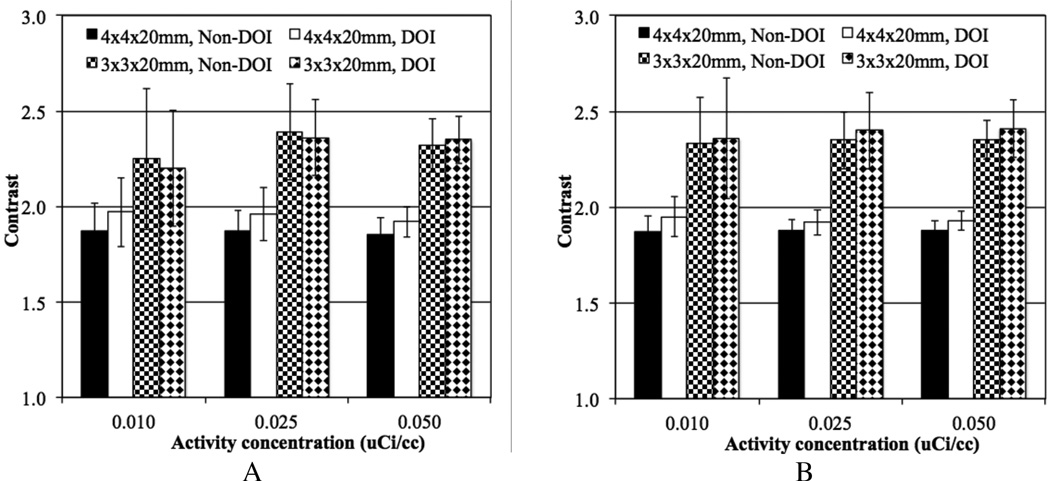
Figure 9 shows ALROC plotted as a function of activity concentration for scanners with the two different crystal widths, with and without 2-level DOI measurement. Results are shown separately for lesion at r=7 cm and r=13 cm. The DOI information shows modest improvement in ALROC values for the 4 mm wide crystals, primarily at the lower activity concentrations. Very little gain is seen in the contrast measurement due to DOI information for both radii of lesion placement (see figure 10), and hence again the statistical noise in the image as determined by the scanner sensitivity dominates the ALROC values. Also, note that the error in contrast measurement (error bars in figure 10) is smaller for lesions at r=13 cm compared to lesions at r=7 cm, even though the contrast itself is similar. This is due to a reduced attenuation of events generated at a larger radius and hence better noise characteristics, which also leads to a better ALROC performance for lesions at r= 13 cm as seen in figure 9.
Figure 9.
ALROC results for spheres at radial positions of (A) 7 cm and (B) 13 cm, shown as a function of activity concentration for scanners with varying crystal width and without DOI or 2-level DOI information. Results are shown for scanners using 20 mm LYSO crystals, 600ps timing resolution, and a scanner AFOV of 72 cm. The total scan time is equivalent to 10 minutes for imaging a 100 cm long patient or object.
Figure 10.
Average contrast results for all spheres at radial positions of (A) 7 cm and (B) 13 cm, (8 spheres per image times 5 images), shown as a function of low activity concentration for scanners with varying crystal width and without DOI or 2-level DOI information. Results are shown at the iteration numbers where maximum ALROC is achieved for 72 cm long scanners using 20 mm long LYSO crystals and 600ps timing resolution. The total scan time is equivalent to 10 minutes for imaging a 100 cm long patient or object. The error bars are ± 0.5 standard deviation of contrast over all 80 spheres.
4. Discussion
Using clinically relevant metrics of ALROC and lesion contrast we investigated the impact of long AFOV on PET scanner performance with special focus on our ability to reduce injected activity. While it is straightforward that increased scanner AFOV will lead to improved system sensitivity, it is less obvious to what extent any possible degradation in scanner spatial resolution and collection of increased scatter coincidences will impact the scanner imaging performance. Our results show that in a scanner with 72 cm AFOV injected activity can be reduced by about a factor of 10 (relative to an 18 cm AFOV scanner) and still achieve similar ALROC results using the exact same detector performance. Improved timing resolution leads to further gains in the ALROC results.
Using smaller crystals (3 mm wide as opposed to 4 mm wide crystals) in the detector design leads to a higher lesion contrast measurement due to improved spatial resolution. However, noise in the image due to imaging at low activity concentrations and a fixed scan time dominates lesion detection task leading to no gains in ALROC. Using the smaller crystals also reduces the packing fraction in the detector, leading to a lower sensitivity (about 10%) relative to the scanner modeled with 4 mm wide crystals. Hence, the ALROC values are lower for the scanner using 3 mm wide crystals except at the higher activity levels where the ALROC values approach the maximal value of 1. Previously, we and others have shown that improved detector resolution leads to a gain in both contrast measurement and ALROC results for scanners with shorter (about 18 cm) AFOV (Surti et al., 2013a, Thoen et al., 2013). However, in that study smaller lesions (5 mm diameter) with higher activity uptake ratio (6:1) were studied at clinical 18F-FDG activity concentrations (0.1 µCi/cc). Hence, the gain in lesion contrast measurement was significant with the use of smaller crystals. Additionally, image noise was lower due to imaging at higher activity levels, thereby leading to an improvement in ALROC values with smaller crystals.
Using a 2-level DOI measurement (20 mm thick crystal divided into two layers of equal 10 mm thickness) leads to a small gain in ALROC results with 4 mm wide crystals. This result is again contrary to what was shown previously for shorter AFOV scanners (Surti et al., 2013a, Thoen et al., 2013) where the level DOI information showed an improvement in ALROC especially when using smaller crystals. This difference is once again explained by no improvement seen in contrast measurement in the current study with the 2-level DOI measurement, and increased noise due to imaging at lower activity levels. Hence, the ALROC does not improve with the 2-level DOI detector.
Improving timing resolution of current detector designs (without DOI information) from 600ps to 450ps gives similar or better performance relative to the addition of the 2-level DOI information with equal crystal layer thickness. Reducing the crystal thickness to 15 mm degrades ALROC performance relative to a 20 mm thick crystal with the same timing resolution. Since timing resolution is known to be correlated with shorter crystals (Wiener et al., 2013) it is conceivable that with 4×4×15 mm3 LSO or LYSO crystals one can achieve better performance than with 4×4×20 mm3 LSO or LYSO crystals. In particular, our results show that a detector with 4×4×15 mm3 LSO crystals and 300ps timing resolution gives as good a performance as detector using 4×4×20 mm3 LSO crystals with 450ps timing resolution. Hence, the use of 15 mm long crystals can be a cost-effective solution for a scanner with long AFOV if it can be demonstrated that reasonable improvement in timing resolution is achieved relative to 20 mm long crystals in a similar detector design.
In our study we simulated a 70 cm long phantom which can degrade the performance of a traditional 18 cm long scanner due to activity outside the FOV relative to a 72 cm long scanner in terms of additional scatter and random coincidences. In our simulations we modeled the scanner end-shields which help limit this effect. Together with use of a lower energy threshold of 440 keV (fairly standard for modern LSO or LYSO based scanners) the scatter fraction is around 40% for both the 18 cm and 72 cm long scanners indicating that the impact of increased scatter events from out of FOV activity is not significant. The total random coincidences in the 72 cm long scanner will be higher compared to the 18 cm long scanner due to increased singles rate and the need to use a slightly larger coincidence timing window in order to collect oblique LORs. However, the randoms-to-true coincidence ratio per axial slice (or cm) is the same for the two scanner designs (72 cm and 18 cm AFOV) for the same coincidence timing window, and increase by about 15% in the 72 cm long scanner when using a larger coincidence timing window to collect all true coincidence events. Hence, especially when imaging at low activity levels, we do not expect our conclusion about the factor of ten gain in ALROC performance due to a 72 cm long scanner to change, even after inclusion of random coincidences.
Improved spatial resolution can potentially have an impact on the ALROC results for smaller lesions (< 1 cm in diameter) and more importantly after collecting more counts by imaging longer or at higher activity levels. In this study our focus was on applications which require lower injected activity levels while fixing the total scan time to current clinical practice. Longer scan times could be utilized to recover some of the benefits due to improved detector spatial resolution. In our study we evaluated crystal widths of 4 mm and 3 mm with the goal of evaluating systems that are similar to current state-of-art (4 mm wide crystals) and potentially improved designs in the future (3 mm wide crystals). Using crystals wider than 4 mm may be useful when imaging lesions larger than 1 cm, but the aim of this study was not to greatly reduce the intrinsic performance of the system while increasing the scanner AFOV.
With no upper limit on the MRD, parallax error is expected to degrade the system performance for a scanner with 72 cm AFOV. Hence, some DOI measurement capability was expected to have a bigger impact on the longer AFOV scanner. However, in our study we chose the two crystals layers to have equal thickness, similar to the design used in the prototype HRRT system (Wienhard et al., 2002). However, even for direct impingement of 511 keV photons, the detection sensitivity for interactions only in the first layer will be more than a factor of two higher than in the second layer. Hence, in order to see any possible benefit of the DOI measurement, the crystal layer thickness for the two DOI levels may need to be optimized in the future after taking into account the detection efficiencies for all incident angles. Such an evaluation was beyond the scope of this study.
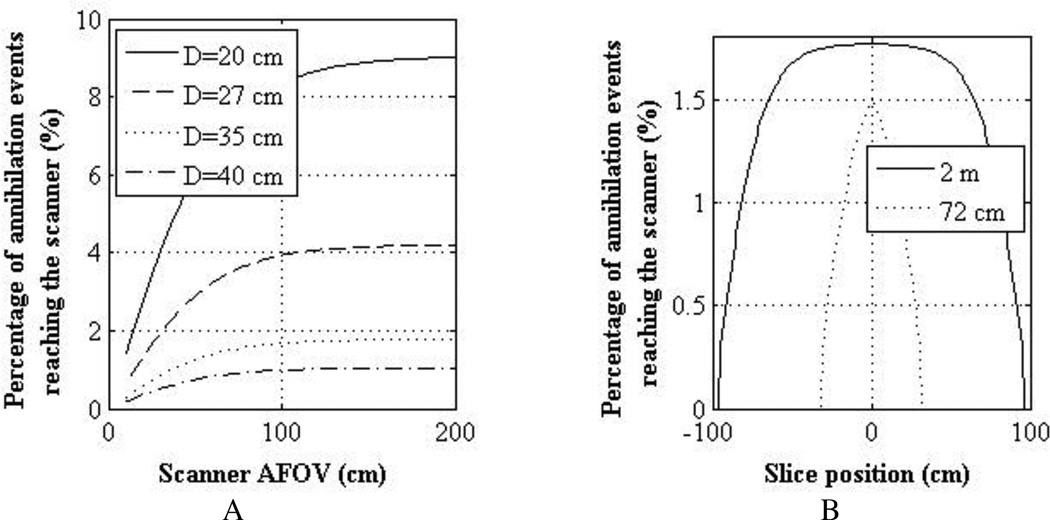
The results presented in this study are for a scanner with an AFOV of 72 cm, but they have relevance to 2 m long scanners as well. In figure 11A we have results from a simulation study showing, as a function of scanner AFOV, the percentage of annihilation events generated in the center slice of a scanner that hit the detector surface. Results are shown for a 2 m long cylindrical phantom uniformly filled with water and having diameters of 20, 27, 35, and 40 cm (ranging from a small to an obese patient). Attenuation was also modeled in this calculation. As shown, for events originating in the center slice of the scanner (as done in our lesion study in this work), a 72 cm AFOV scanner will have 14–18% less coincidence events reaching the detector surface compared to a 2 m long scanner. In figure 11B, we show the calculated axial profile of events reaching the detector surface as a function of emission axial position for scanners with AFOV of 72 cm and 2 m. For clarity, results are shown only for the 35 cm diameter cylindrical phantom. For events in the central slice, the 2 m long scanner has about 15% higher incident events than the 72 cm long scanner. However, the profile is fairly flat (due to the solid angle and attenuation effects) in the central 100 cm region for the 2 m long scanner implying that a single bed position is sufficient for imaging a 100 cm long object. The profile for the 72 cm long scanner has the triangular pattern that is typical of shorter AFOV scanners, which will require multiple overlapping bed positions to image a 100 cm long object. Hence, a 2 m long scanner will: (i) have a slightly higher intrinsic sensitivity due to the larger solid angle coverage, and (ii) require only one bed position for imaging a 100 cm long object. So the 72 cm long scanner design evaluated in this work is equivalent to imaging the lesion phantom in a 2 m long scanner with the MRD set at 72 cm. However, a total scan time of 10 minutes to image a 100 cm long object will translate into a 10 minute scan time for the single bed position needed in the 2 m long scanner (as opposed to 160s scan time for a single bed position in the 72 cm long scanner). The results presented here for the 72 cm long AFOV scanner are therefore applicable to a 2 m long scanner after scaling the activity concentrations by a factor of 0.27. Hence, compared to a traditional scanner the injected activity can be reduced by about a factor 40 in a 2 m long scanner while maintaining similar imaging performance.
Figure 11.
(A) Percentage of annihilation events generated in central slice of a 2 m long cylindrical water-filled phantom that reach the scanner surface as a function of scanner AFOV. Results are shown for phantom with four different diameters (20, 27, 35, and 40 cm). (B) Percentage of annihilation events generated as a function of slice number in a 35 cm diameter and 2 m long cylindrical water-filled phantom that reach the scanner surface. Results are shown for scanners with AFOV of 2 m and 72 cm.
5. Conclusion
In conclusion, a 72 cm long scanner allows a factor of ten reduction in injected dose compared to a traditional 18 cm long scanner while maintaining similar performance for lesion detection and localization as measured with the ALROC metric. As expected, improved timing resolution leads to noticeable gains in the imaging performance, and hence further reduction in the injected dose. Using 3 mm wide crystals does not provide any noticeable gains for the imaging tasks evaluated in this study mainly due to the increased noise in the image when imaging at low activity levels. Parallax error can be an important drawback in designing long AFOV scanners, but a detector that provides a 2-level DOI information by effectively splitting the crystals into two equal lengths provides only small gains in lesion detectability. While 20 mm long crystals give the best performance due to increased sensitivity, designing a scanner with shorter (15 mm) crystals can provide a good cost-effective detector design solution for the long AFOV scanners if sufficient gains in timing resolution are achieved over 20 mm long crystals.
Acknowledgments
This work was partly supported by the National Institutes of Health, grant numbers R01-EB009056 and R01-CA113941.
References
- Badawi RD, Kohlmyer SG, Harrison RL, Vannoy SD, Lewellen TK. The effect of camera geometry on singles flux, scatter fraction and trues and randoms sensitivity for cylindrical 3D PET - A simulation study. IEEE Trans. Nucl. Sci. 2000;47:1228–1232. [Google Scholar]
- Bettinardi V, Presotto L, Rapisarda E, Picchio M, Gianolli L, Gilardi MC. Physical Performance of the new hybrid PET/CT Discovery-690. Med. Phys. 2011;38:5394–5411. doi: 10.1118/1.3635220. [DOI] [PubMed] [Google Scholar]
- Cherry SR. The 2006 Henry N. Wagner Lecture: Of Mice and Men (and Positrons)—Advances in PET Imaging Technology. J Nucl Med. 2006;47:1735–1745. [PubMed] [Google Scholar]
- Conti M, Bendriem B, Casey M, Eriksson L, Jakoby B, Jones WF, Jones J, Michel C, Nahmias C, Panin V, Rappoport V, Sibomana M, Townsend DW. Performance of a high sensitivity PET scanner based on LSO panel detectors. IEEE Trans Nucl Sci. 2006;53:1136–1142. [Google Scholar]
- Crespo P, Reis J, Couceiro M, Blanco A, Ferreira NC, Marques RF, Martins P, Fonte P. Whole-Body Single-Bed Time-of-Flight RPC-PET: Simulation of Axial and Planar Sensitivities With NEMA and Anthropomorphic Phantoms. IEEE Trans Nucl Sci. 2012;59:520–529. [Google Scholar]
- Daube-Witherspoon ME, Surti S, Perkins AE, Kyba CCM, Wiener RI, Karp JS. Imaging Performance of a LaBr3-based Time-of-Flight PET Scanner. Phys. Med. Biol. 2010;55:45–64. doi: 10.1088/0031-9155/55/1/004. [DOI] [PMC free article] [PubMed] [Google Scholar]
- Eriksson L, Conti M, Melcher CL, Townsend DW, Eriksson M, Rothfuss H, Casey ME, Bendriem B. Towards Sub-Minute PET Examination Times. IEEE Trans. Nucl. Sci. 2011;58:76–81. [Google Scholar]
- Eriksson L, Townsend D, Conti M, Eriksson M, Rothfuss H, Schmand M, Casey ME, Bendriem B. An investigation of sensitivity limits in PET scanners. Nucl. Instr. Meth. (A) 2007;580:836–842. [Google Scholar]
- Hunter WCJ, Harrison RL, Gillispie SB, Macdonald LR, Lewellen TK. Parametric design study of a long axial field-of-view PET scanner using a block-detector tomograph simulation of a cylindrical phantom. In: Seibert JA, editor. IEEE Nuclear Science Symp. and Med. Imag. Conf; IEE; Orlando, FL. 2009. pp. 3900–3903. [DOI] [PMC free article] [PubMed] [Google Scholar]
- Jakoby BW, Bercier Y, Conti M, Casey ME, Bendriem B, Townsend DW. Physical and clinical performance of the mCT time-of-flight PET/CT scanner. Phys. Med. Biol. 2011;56:2375–2389. doi: 10.1088/0031-9155/56/8/004. [DOI] [PubMed] [Google Scholar]
- Levin CS, Deller T, Peterson WT, Maramraju S, Kim C, Prost R. Initial results of simultaneous whole-body ToF PET/MR. Annual Meeting of the Society of Nuclear Medicine; 2014; St. Louis, Mo. [Google Scholar]
- Macdonald LR, Harrison RL, Alessio AM, Hunter WCJ, Lewellen TK, Kinahan PE. Effective count rates for PET scanners with reduced and extended axial field of view. Phys. Med. Biol. 2011;56:3629–3643. doi: 10.1088/0031-9155/56/12/011. [DOI] [PMC free article] [PubMed] [Google Scholar]
- Matej S, Lewitt RM. Practical considerations for 3-D image reconstruction using spherically symmetric volume elements. Ieee Transactions on Medical Imaging. 1996;15:68–78. doi: 10.1109/42.481442. [DOI] [PubMed] [Google Scholar]
- Miller M, Griesmer J, Jordan D, Laurence T, Muzic R, Narayanan M, Natarajamani D, Su K-H, WANG S. Initial characterization of a prototype digital photon counting PET system. Society of Nuclear Medicine Annual Meeting Abstracts. 2014;55:658. [Google Scholar]
- Muehllehner G, Karp JS, Surti S. Design considerations for PET scanners. Q. J. Nucl. Med. 2002;46:16–23. [PubMed] [Google Scholar]
- Poon JK, Dahlbom M, Moses WW, Balakrishnan K, Wang W, Cherry SR, Badawi RD. Optimal whole-body PET scanner configurations for different volumes of LSO scintillator: a simulation study. Phys. Med. Biol. 2012;57:4077–4094. doi: 10.1088/0031-9155/57/13/4077. [DOI] [PMC free article] [PubMed] [Google Scholar]
- Popescu LM. Iterative image reconstruction using geometrically ordered subsets with list-mode data. In: Seibert JA, editor. IEEE Nuclear Science Symposium and Medical Imaging Conference; IEEE Nuclear & Plasma Sciences Society; Rome, Italy. 2004. pp. 3536–3540. 2004. [Google Scholar]
- Popescu LM, Lewitt RM. Small nodule detectability evaluation using a generalized scan-statistic model. Phys Med Biol. 2006;51:6225–6244. doi: 10.1088/0031-9155/51/23/020. [DOI] [PubMed] [Google Scholar]
- Shore AR, Surti S, Karp JS. Design study of a whole-body PET scanner with improved spatial and timing resolution. IEEE Nuclear Science Symposium and Medical Imaging Conference; Anaheim, CA. 2012. 2012. [DOI] [PMC free article] [PubMed] [Google Scholar]
- Surti S, Karp JS, Muehllehner G. Image quality assessment of LaBr3-based whole-body 3D PET scanners: a Monte Carlo evaluation. Phys. Med. Biol. 2004;49:4593–4610. doi: 10.1088/0031-9155/49/19/010. [DOI] [PubMed] [Google Scholar]
- Surti S, Kuhn A, Werner ME, Perkins AE, Kolthammer J, Karp JS. Performance of Philips Gemini TF PET/CT scanner with special consideration for its time-of-flight imaging capabilities. J. Nucl. Med. 2007;48:471–480. [PubMed] [Google Scholar]
- Surti S, Shore AR, Karp JS. Design Study of a Whole-Body PET Scanner with Improved Spatial and Timing Resolution. IEEE Trans. Nucl. Sci. 2013a;60:3220–3226. doi: 10.1109/TNS.2013.2265605. [DOI] [PMC free article] [PubMed] [Google Scholar]
- Surti S, Werner ME, Karp JS. Study of PET scanner designs using clinical metrics to optimize the scanner axial FOV and crystal thickness. Phys. Med. Biol. 2013b;58:3995–4012. doi: 10.1088/0031-9155/58/12/3995. [DOI] [PMC free article] [PubMed] [Google Scholar]
- Swensson RG. Unified measurement of observer performance in detecting and localizing target objects on images. Med Phys. 1996;23:1709–1725. doi: 10.1118/1.597758. [DOI] [PubMed] [Google Scholar]
- Thoen H, Keereman V, Mollet P, Van holen R, Vandenberghe S. Influence of detector pixel size, TOF resolution and DOI on image quality in MR-compatible whole-body PET. Phys. Med. Biol. 2013;58:6459. doi: 10.1088/0031-9155/58/18/6459. [DOI] [PubMed] [Google Scholar]
- Watanabe M, Shimizu K, Omura T, Sato N, Takahashi M, Kosugi T, Ote K, Katabe A, Yamada R, Yamashita T, Tanaka E. A high-throughput whole-body PET scanner using flat panel PS-PMTs. IEEE Trans Nucl Sci. 2004;51:796–800. [Google Scholar]
- Werner ME, Surti S, Karp JS. Implementation and Evaluation of a 3D PET Single Scatter Simulation with TOF Modeling. IEEE Nuclear Science Symposium and Medical Imaging Conference; San Diego, CA. 2006. pp. 1768–1773. 2006. [Google Scholar]
- Wiener RI, Surti S, Karp JS. DOI Determination by Rise Time Discrimination in Single-ended Readout for TOF PET Imaging. IEEE Trans. Nucl. Sci. 2013;60:1478–1486. doi: 10.1109/tns.2013.2243166. [DOI] [PMC free article] [PubMed] [Google Scholar]
- Wienhard K, Schmand M, Casey ME, Baker K, Bao J, Eriksson L, Jones WF, Knoess C, Lenox M, Lercher M, Luk P, Michel C, Reed JH, Richerzhagen N, Treffert J, Vollmar S, Young JW, Heiss WD, Nutt R. The ECAT HRRT: Performance and first clinical application of the new high resolution research tomograph. IEEE Trans. Nucl. Sci. 2002;49:104–110. [Google Scholar]


