
Table 1. Heat map of liver LCFA profiles showing relative fold change of the metabolites on day 14 between PF-05231023 vs. vehicle treated samples.
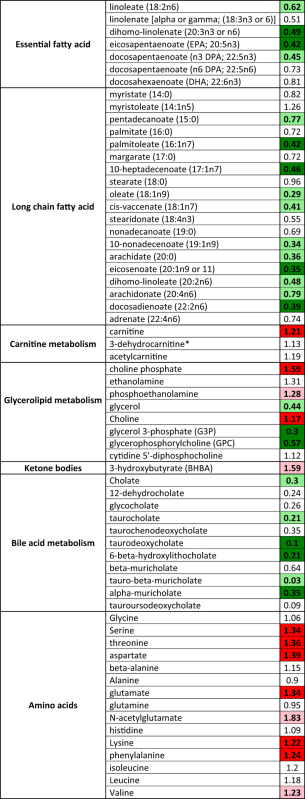 |
Statistically significant reductions are highlighted in (dark green and red indicates p < 0.05, light green and red indicates 0.05 < p < 0.1) using paired t-test. No color indicates lack of significant change.