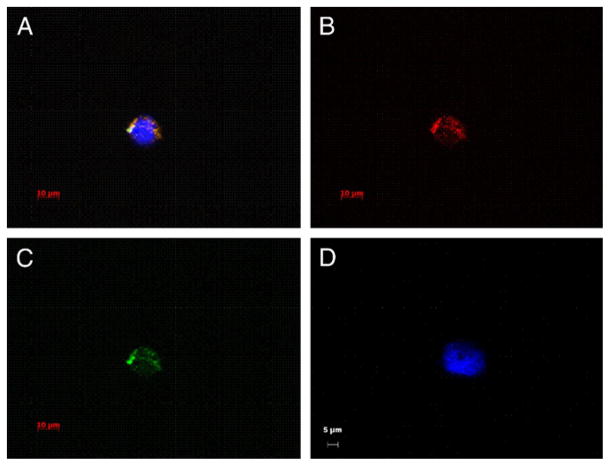
Figure 4.
Fluorescence microscopy shows digital images of BM cells containing fluorescent labeled prostate tumor microvesicles. A to C, representative PKH26 and CFSE labeled prostate tumor derived microvesicles in BM cell. Scale bar indicates 10 μm. A, composite of images using DAPI, FITC and Texas Red filters. Yellow-orange areas indicate double positive PKH26 and CFSE label in microvesicles. Blue area indicates nuclear stain DAPI. B, image using Texas Red filter. C, image using FITC filter. D, representative DAPI stained BM cell negative for fluorescently labeled microvesicles. Reduced from 63×, scale bar indicates 5 μm.

