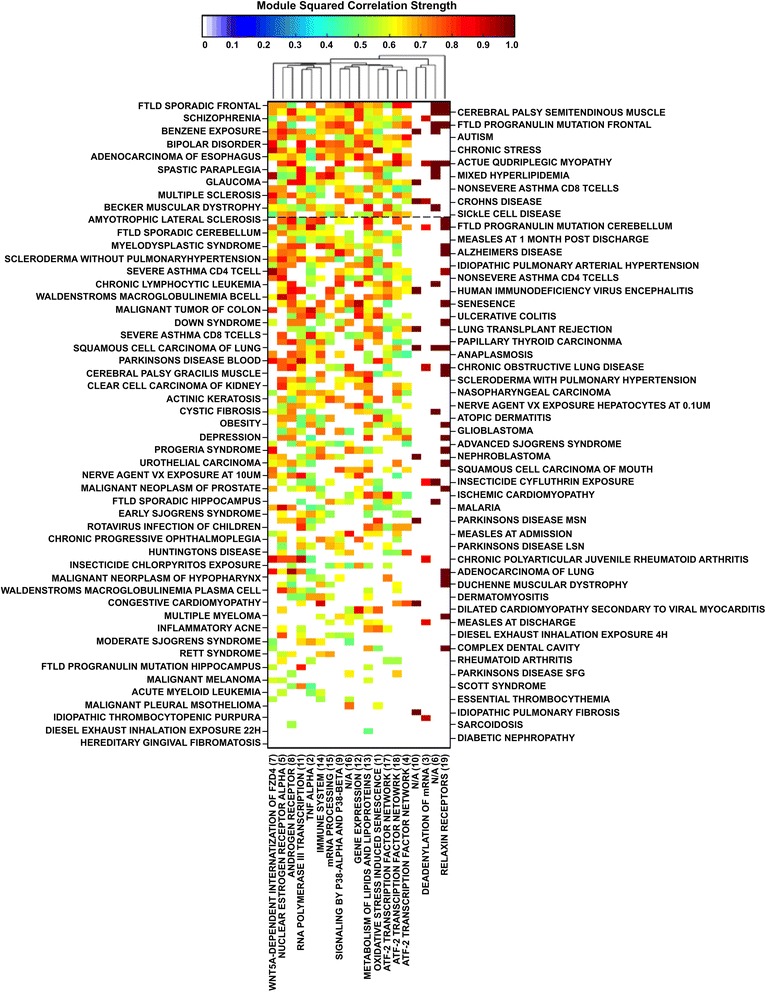
Fig. 3.

Matrix of squared correlation values for GWI with all human diseases (Additional file 1: Table S1) in all affected modules (Fig. 1) with values between 0 and 1 according to the color bar. Diseases are arranged in decreasing GA value and modules refer to those presented in Fig. 1 and Additional file 3: Table S2. Dashed black line represent the GA 50 % mark. Modules are clustered hierarchically using a Euclidean distance metric and average linkage to generate the hierarchical tree
