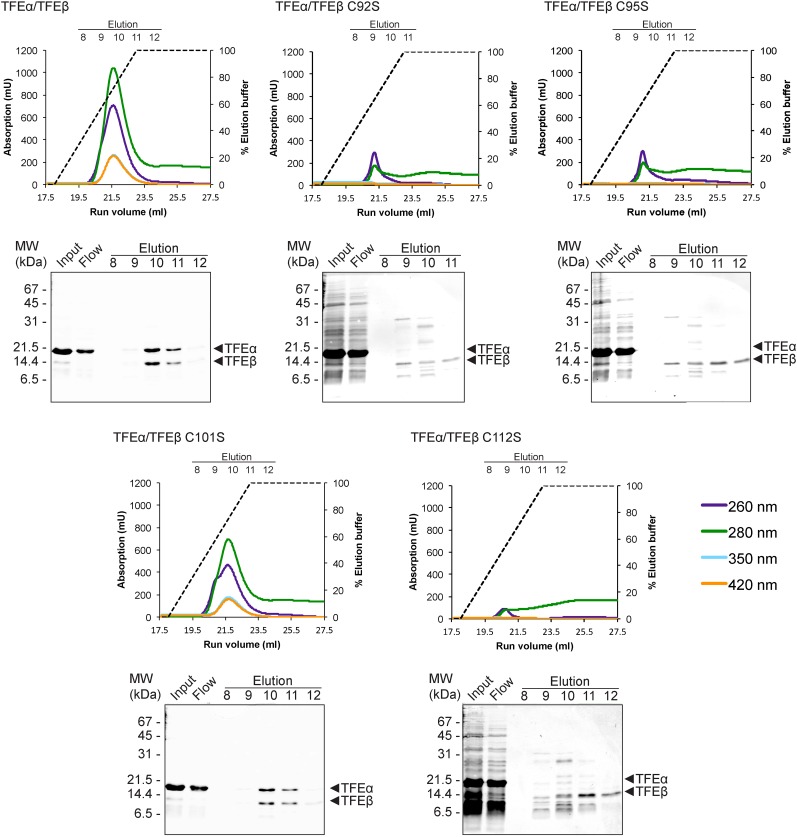
Figure 4. TFEαβ dimerization depends on the integrity of the Fe-S cluster.
Ni-affinity chromatography of TFEβ-His (WT), TFEβ-His C92S, TFEβ-His C95S, TFEβ-His C101S or TFEβ-His C112S co-expressed with TFEα. The graphs show the absorption profile monitored at 260 nm, 280 nm, 350 nm, and 420 nm. Absorption in the visible light range (350 nm and 420 nm) is indicative for the presence of the Fe-S cluster. The elution fractions analysed by SDS-PAGE are indicated. The panels below show Coomassie-stained SDS-gels with the (heat-stable) input, flow, and elution fractions.

