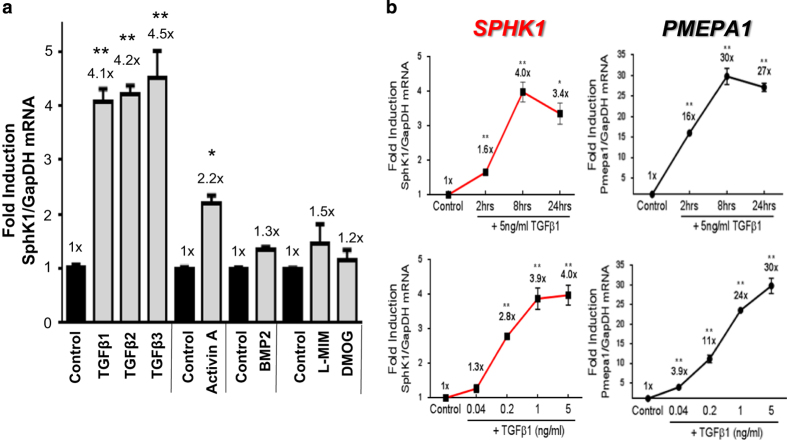
Figure 3.
Effects of various TGFβ isoforms/family members and kinetics of SPHK1 expression in MDA-MB-231 cells. MDA-MB-231 cells were treated with recombinant hTGFβ1 (5 ng ml−1), hTGFβ2 (5 ng ml−1), hTGFβ3 (5 ng ml−1), hActivin-A (50 ng ml−1) or hBMP-2 (50 ng ml−1) for 8 h followed by qRT-PCR analysis (a). Cells treated with hypoxia mimetics L-mimosine (L-MIM) and dimethyloxalyl glycine (DMOG) were harvested after 24 h (a). Both time and dose response kinetic experiments for SPHK1 and PMEPA1 were treated for approximately 8 h followed by qRT-PCR analysis (b). All data were normalized to GAPDH mRNA, analyzed using the Δ/Δ CT method and plotted as fold induction versus the untreated control group (value=1x). All data are plotted as mean fold-induction±s.e.m., n=3 per treatment group. *P<0.05 and **P<0.01 versus control group (one-way ANOVA, Bonferroni-corrected).

