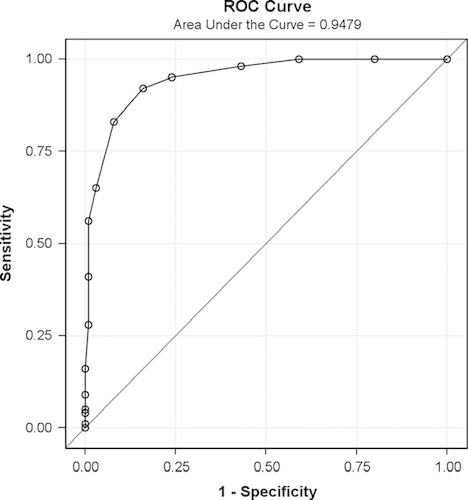
FIGURE 1.

Receiver-operating curve (ROC) for distinguishing IBS (n=100) from HC (n=100) using composite score of digestive symptoms. Sensitivity versus 1−specificity is given for different cutoff values. The area under the curve was 0.95. HC indicates healthy control; IBS, irritable bowel syndrome.
