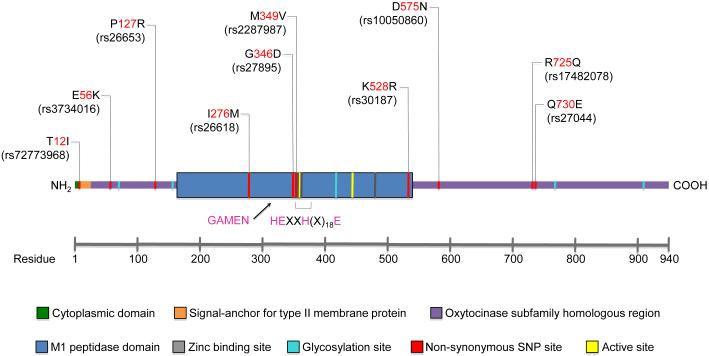
Figure 1. Schematic diagram of ERAP1.
The locations of common (>5% frequency) naturally occurring amino acid variants and their corresponding SNPs are shown. The rheumatic disease-associated variants (127, 349, 528, 575, 725, and 730) are shown in Figure 2.

