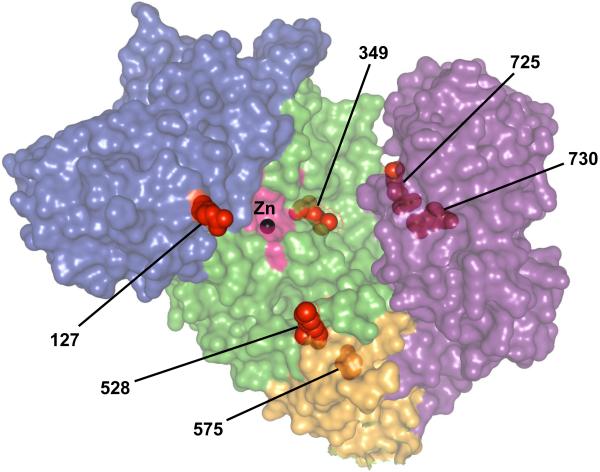
Figure 2. Rheumatic disease-associated missense variants of ERAP1.
A surface map of ERAP1 demonstrates the locations of six rheumatic disease-associated amino acid substitutions of ERAP1 (shown as red spheres). The surface coloring indicates the domain structures (I = blue, II = green, III = orange, IV = purple) and identifies the enzyme’s catalytic site (pink), which contains the catalytic Zn2+ molecule (black sphere). This model was created using 3MDJ and PyMol software. (Courtesy of M. Ombrello)

