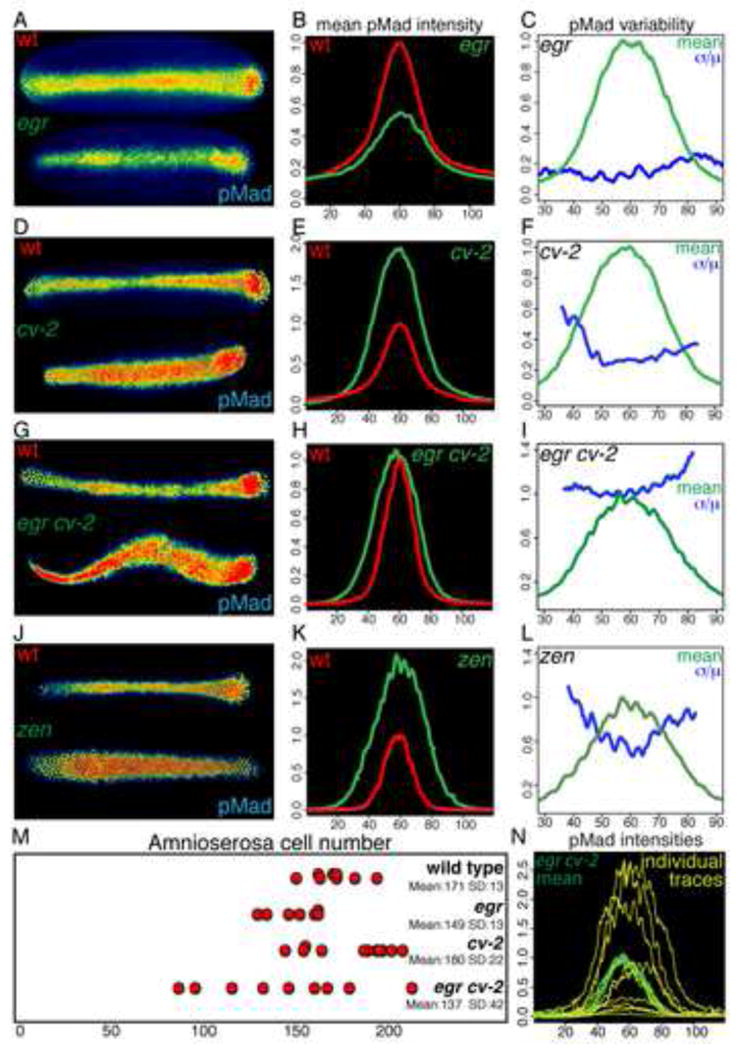
FIGURE 3. BMP signaling in egr, cv-2, egr cv-2 and zen embryos.

(A–L) Representative pMad staining (A,D,G,J), mean intensities (B,E,H,K) and variability (C,F,I,L) of 6 wild-type and 9 egr embryos (A–C), 8 wild-type and 8 cv-2 embryos (D–F), 7 wild-type and 15 egr cv-2 embryos (G–I), 9 wild-type and 10 zen7 embryos (J–L). (M) Distribution, mean and standard deviation of amnioserosa cell number in wild-type, egr, cv-2, and egr cv-2 embryos. (N) Individual traces of pMad intensities of egr cv-2 embryos with mean intensity (light green). See Figures S2–S5 and Table S1 for related data.
