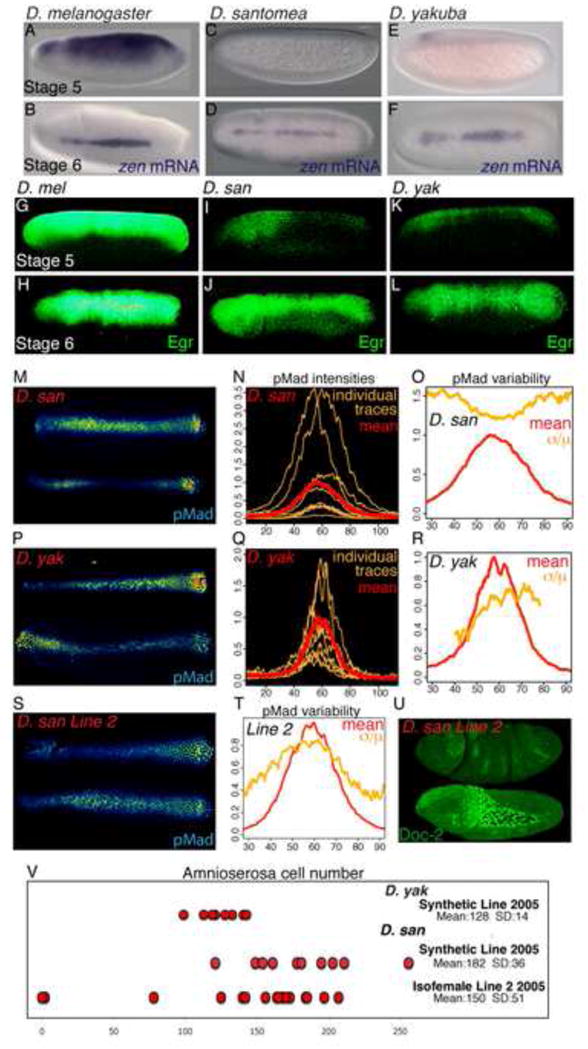
FIGURE 4. BMP signaling is variable in D. santomea and D. yakuba embryos.

(A–L) in situ of zen mRNA (A–F) or anti-Egr (G–L) staining in D. melanogaster (A–B,G–H), D. santomea (C–D,I–J) and D. yakuba embryos (E–F,K–L). Stage 5 embryos, lateral view (A,C,E,G,I,K); Stage 6 embryos, dorsal view (B,D,F,H,J,L). Representative pMad staining (M,P, S), individual and mean traces (N,Q) of pMad intensity and variability (O,R,T) of 10 D. santomea (M–O), 12 D. yakuba embryos (P–R) and 13 D. santomea Isofemale Line 2 embryos (S,T). (U) Lateral views of D. santomea Isofemale Line 2 embryos stained with anti-Dorsocross2 to identify amnioserosa cells. The top embryo completely lacks any amnioserosa, while the bottom embryo has a normal number of amnioserosa cells. (V) Distribution, mean and standard deviation of amnioserosa cell number in D. yakuba and D. santomea Synthetic 2005 lines, and D. santomea Isofemale line 22005 embryos. See Figure S6 and Table S2 for related data.
