
Figure 5.
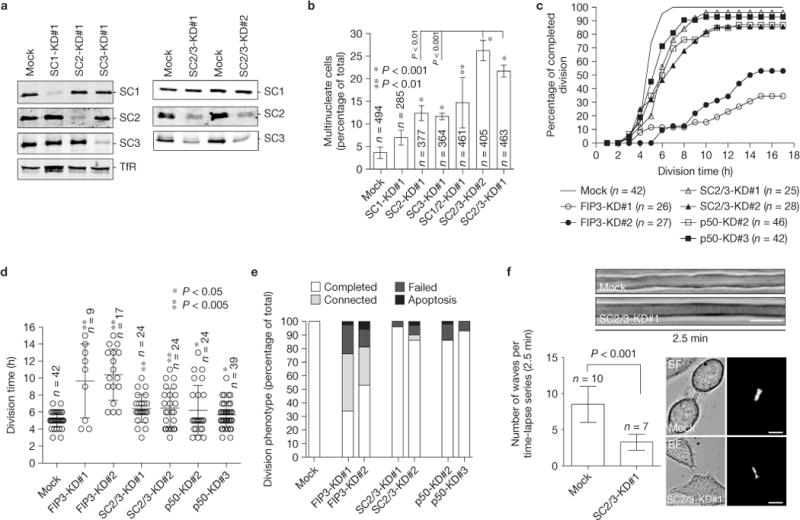
SCAMP2 and SCAMP3 are required for successful completion of cytokinesis. (a) Western blot analysis probed for the indicated proteins in single and double SCAMP knockdowns (KD). (b) Quantification of multinucleate HeLa cells in single or double SCAMP knockdowns. The data shown are means and s.d. from three independent experiments. n indicates the number of cells counted. The asterisks indicate a statistically significant difference from the mock-transfected cells. (c–e) Mock, FIP3, SCAMP2/3 or p50RhoGAP siRNA-treated (KD) HeLa cells were imaged by time-lapse microscopy for 24 h (time-lapse 1h). The data shown are the percentage of cells that completed division (c), the average time required for cells to divide (d) and the division phenotype (e). n indicates the number of cells counted. The error bars represent s.d. of the mean. The asterisks indicate a statistically significant difference from the mock-transfected cells. (f) Mock-or SCAMP2/3-siRNA-treated cells were imaged by time-lapse microscopy to analyse the dynamics of the ICB during late telophase, as determined by FIP3–GFP localization within the ICB (images on right). Shown are representative kymographs used to quantify the dynamics of the ICB. The histogram depicts means and s.d. of the data. n is the number of randomly chosen cells in late cytokinesis. Scale bars, 5μm. Uncropped images of blots are shown in Supplementary Fig. S7.