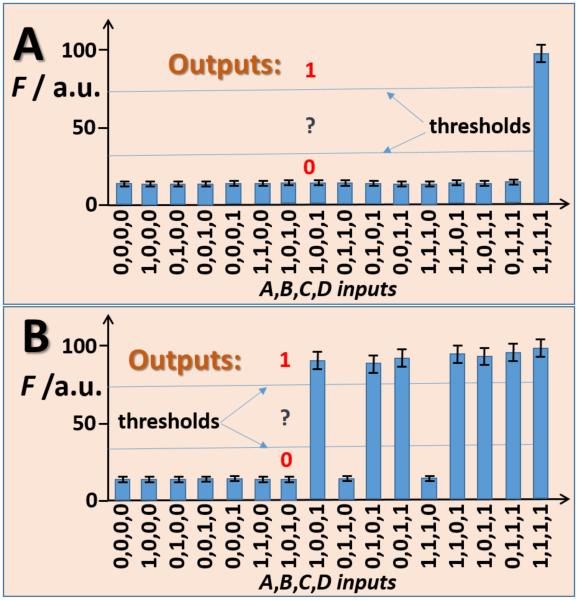
Figure 4.
A-B) Fluorescence signal corresponding to the dye-labelled oligonucleotide OP1 released from the alginate thin-film when the PQQ-modified electrode was interfaced with the enzymatic logic gate systems shown in Figures 2A and 2B, respectively, when different combinations of input signals were applied. The bars show the fluorescence measured after 30 min of exposing the electrodes to the enzyme systems. The fluorescence is represented by normalized arbitrary values. The data are average of three independent experiments. Threshold lines separate logic output 0, undefined area and logic output 1.

