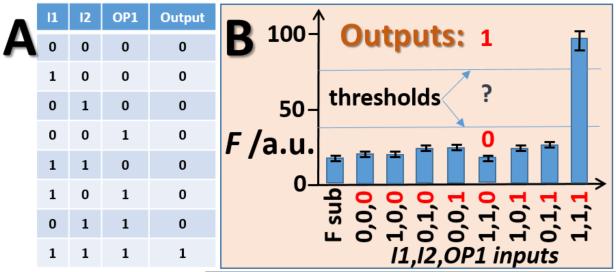
Figure 6.
Digital performance of the 3iAND gate. A) Truth table; B) Fluorescent response of 3iAND in the presence of all possible DNA input combinations. The concentrations of the inputs were as follows. For low inputs (digital 0): I1, 0 nM; I2, 0 nM; OP1 was produced in situ with the concentration set by the system corresponding to output 0 (when substrate inputs A,B,C,D for the enzyme systems were 0,0,0,0). For high inputs (digital 1): I1, 10 nM; I2, 10 nM; OP1 was produced in situ with the concentration set by the system corresponding to output 1 (when inputs A,B,C,D for the enzyme systems were 1,1,1,1). Digital values for OP1 are shown in red. F sub bar, a control sample containing only fluorescent substrate (F substrate, see Figure 5). The bars show the fluorescence measured after 30 min of exposing the electrode to the enzyme systems. The fluorescence is represented by normalized arbitrary values. The data are average of three independent experiments. Threshold lines separate logic output 0, undefined area and logic output 1.

