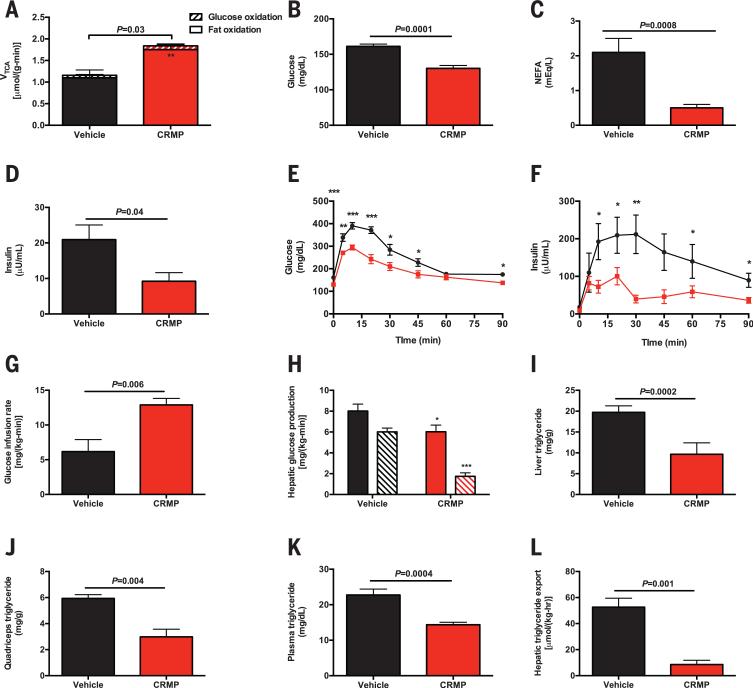
Fig. 1. CRMP improves insulin sensitivity in high-fat–fed rats.
(A) Hepatic VTCA from fat oxidation (solid bars) and glucose oxidation (striped bars) in chow fed rats. (B to D) Fasting plasma glucose, NEFA, and insulin concentrations. (E and F) Plasma glucose and insulin concentrations during an intraperitoneal glucose tolerance test. *P < 0.05, **P < 0.01, ***P < 0.001 by means of Student's t test. (G) Glucose infusion rate during a hyperinsulinemiceuglycemic clamp. (H) Basal (solid bars) and clamped (striped bars) rates of hepatic glucose production. (I to K) Liver, quadriceps, and plasma triglyceride concentrations. (L) Liver VLDL export. In (A) to (L), data are mean ± SEM of n = 6 to 8 rats per group.

