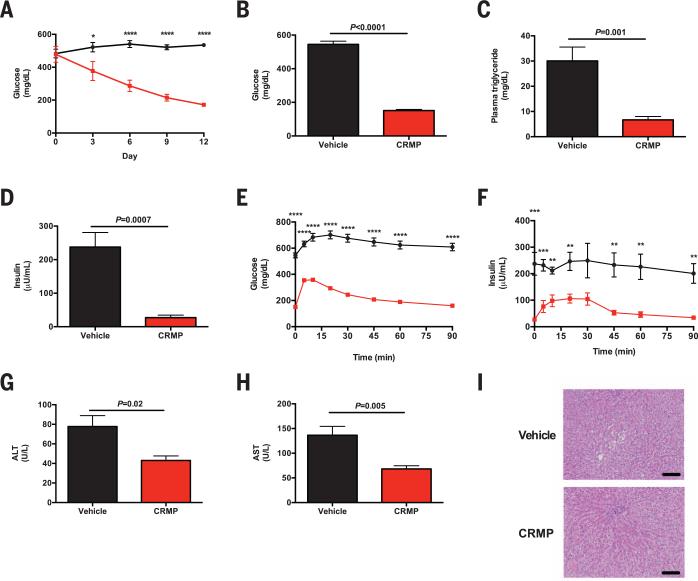
Fig. 2. CRMP improves glucose tolerance in diabetic rats.
(A) Random plasma glucose concentrations in vehicle-treated (black circles) and CRMP-treated rats (red squares). (B to D) Fasting plasma glucose, triglyceride, and insulin concentrations. (E and F) Glucose and insulin concentrations during an intraperitoneal glucose tolerance test. (G and H) Plasma ALT and AST concentrations. (I) Liver histology (hematoxylin and eosin stain). Scale bars, 100 μm. In (A) to (I), *P < 0.05, **P < 0.01, ***P < 0.001, ****P < 0.0001 by means of Student's t test. Data are mean ± SEM of n = 6 to 7 rats per group.

