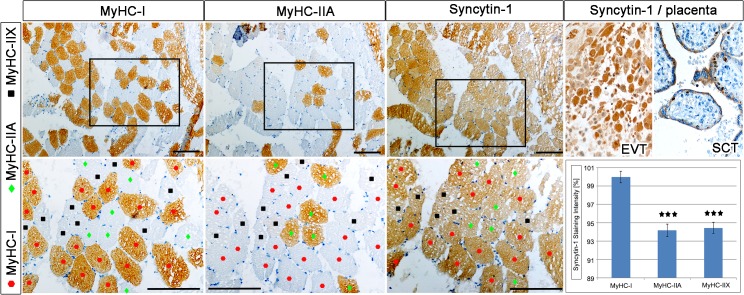
Fig 5. Muscle cross-sections of cyclists after pre-competitive season show consecutive tissue sections with immuno-localization of MyHC-I and MyHC-IIA as well as the fusogenic ERVW-1 env protein Syncytin-1.
For comparison of Syncytin-1 protein expression with muscle cells the far right picture shows a positive control of Syncytin-1 immunolocalization on normal third trimester placental tissues [left = extra villous trophoblasts (EVT); right = syncytiotrophoblast (SCT)]. The graph represents a semi-quantitative analysis of Syncytin-1 protein signal intensity measured using ImageJ. The Syncytin-1 expression was then correlated with the fiber types, including MyHC-I (set to 100%), MyHC-IIA and MyHC-IIX. Note that the upper panels show IHC and the lower panels show magnifications of the squares. Color code represents fiber type in the lower panels: red = MyHC-I, green = MyHC-IIA and difference of both is marked black = MyHC-IIX. Bars = 100μm. *** = statistically significant (p< 0.005).

