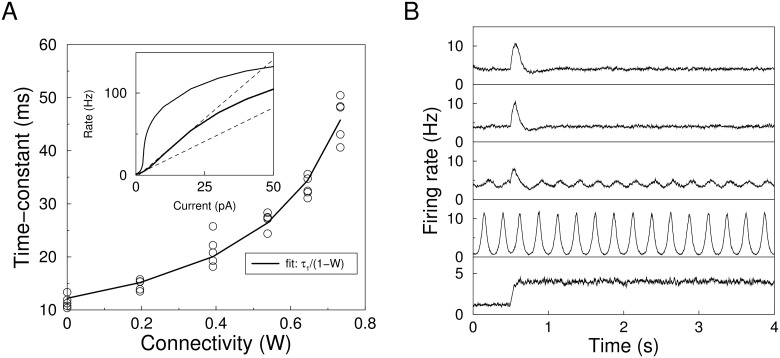
Fig 4. Homeostatic regulation in a network of integrate-and-fire neurons.
A) The effective time-constant of the network as a function of recurrent connection strength. Circles denote simulation results and the curve is the fitted relation τ 1/(1 − w m). Inset shows the f-I curve of the unconnected network (lower curve), the slope at the set-point (lower line) and slope of the envelop (upper line). F-I curve of the connected network (upper curve) is shown for comparison. B) Example population response to step stimuli for varying values of τ 3 corresponding to, from top-to bottom: τ 3 = 380ms (stable according to Aizerman criterion); τ 3 = 240ms (empirically stable); τ 3 = 200ms (edge of instability); τ 3 = 64ms (linear criterion). Bottom panel: network without homeostasis.

