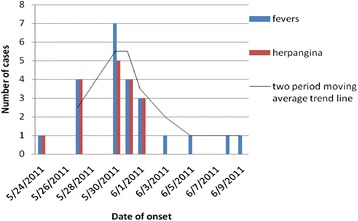
Fig. 1.

Epidemiological data for the febrile illness outbreak caused by CV-A4. Graph showing the number of cases and their clinical symptoms. The trend line for the average number of cases indicates that the outbreak began on 24 May, peaked on 30 May (after intervention), and ended on 10 June
