
Fig. 2.
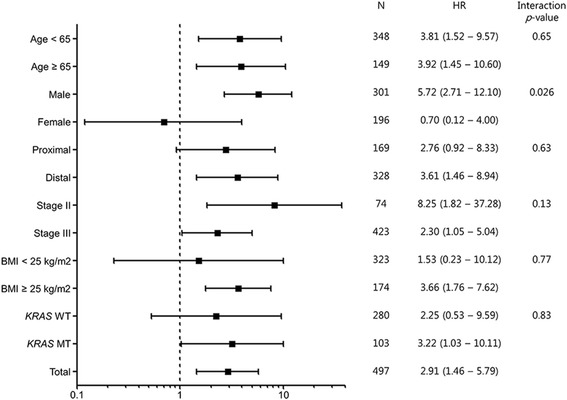
Forest plot demonstrating the risk of death by concurrent methylation (+) compared to concurrent methylation (−) stratified by clinico-pathological factors. All hazard ratios were adjusted by histology, angiolymphatic invasion, and perineural invasion. N number, HR hazard ratio, CI confidence interval, WT wild type, MT mutation type