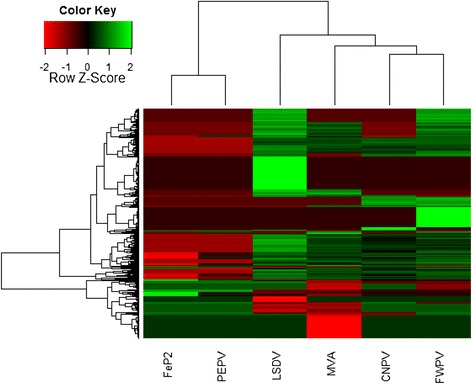
Fig. 1.

Heatmap comparing the differential expression induced in mouse spleens in response to pigeonpox (FeP2), penguinpox (PEPV), lumpy skin disease virus (LSDV), modified vaccinia Ankara (MVA), canarypox virus (CNPV) and fowlpox virus (FWPV). Only genes (with p-value < 0.05) with log2 fold change induction above or below the cutoff (±1) as compared to the mock infected control are shown. Unsupervised hierarchical clustering of the samples is represented by dendograms. Clustering analysis and heatmap was performed in the R package, gplots (Warnes, 2009)
