
Fig 4. Parameter fitting under two different phosphate levels.
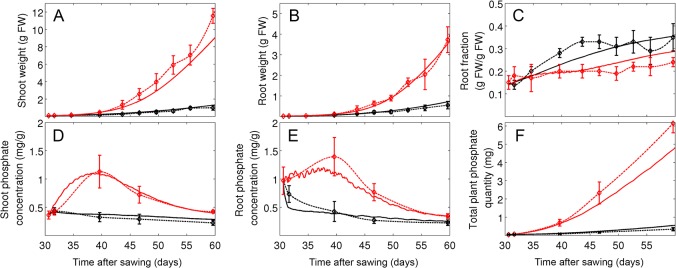
Plants were grown at an intermediate light level (316 μmol m-2 s-1) and at two Pi regimes representing limiting conditions (10 μM, black curves) and intermediate conditions (100 μM, red curves). Simulations (continuous lines) and experimental data (Experiment 2, treatments A and B; dashed lines) are shown for shoot weight (A) and root weight (B), root fraction (C), Pi levels in shoot (D) and in root (E) and total Pi in plants (F). Error bars represent the standard deviations (N = 5).