
Fig 6. Model validation and evaluation of adaptive potential of shoot and root growth towards decreasing Pi supply.
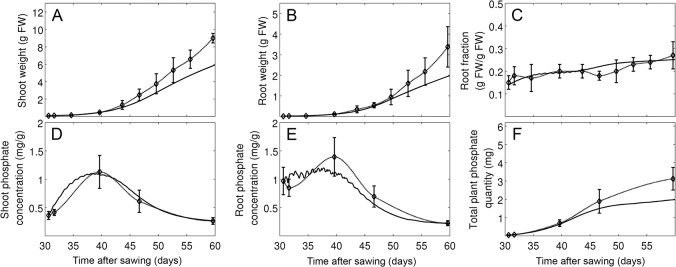
Shoot and root growth was analyzed after a switch from high Pi levels (100 μM) to 10 μM after two weeks (reversed switch compared to Fig 3). Simulations (continuous lines) and experimental data (experiment 2, treatment D; dashed lines) are shown for shoot weight (A) and root weight (B), root fraction (C), Pi levels in the shoot (D) and the root (E) and total Pi per plant (F). Error bars represent the standard deviations (N = 5).