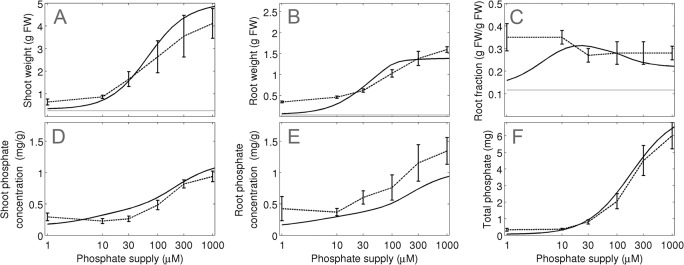
Fig 7. Model validation and evaluation of the adaptive potential of plants to a range of different Pi concentrations.

Simulations (continuous line) and experimental data (experiment 3; dashed line) are shown for (A) shoot and (B) root growth, (C) root fraction, (D) shoot Pi concentration and (E) root Pi concentration and (F) total Pi per plant for plants grown at 6 different Pi concentrations (1, 10, 30, 100, 300, 1000 μM). The grey line in (a)-(c) represents the value at the beginning of the experiment. Error bars represent the standard deviations (N = 10).
