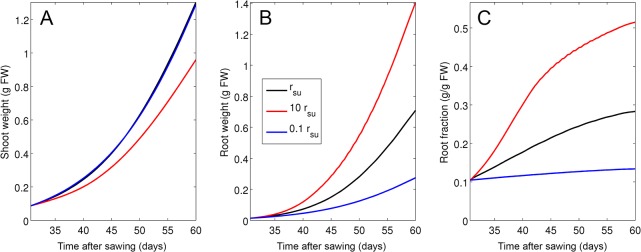
Fig 8. Simulation of growth dynamics as a function of phloem resistance.

Shoot (A) and root (B) weight was simulated in conceptual mutants with decreased or increased phloem resistance (r su) by a factor 0.1 and 10, respectively. Root fraction (C) was decreased by transport deficiency (blue line; factor 0.1), and increased by stimulated transport (red line; factor 10) relative to the control (black line).
