Figure 7.

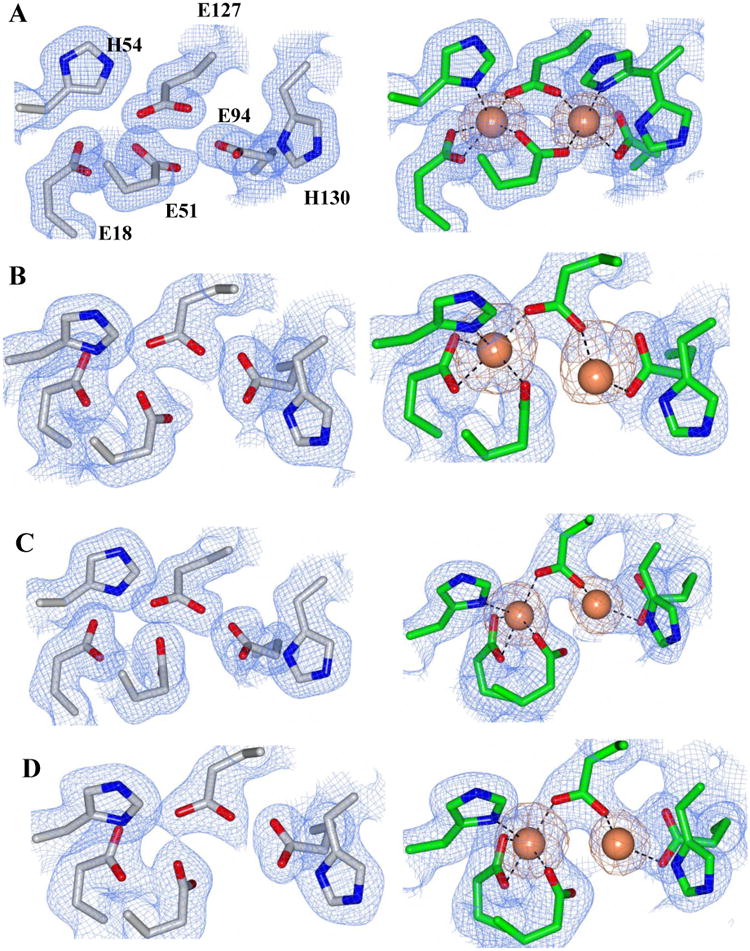
2Fo-Fc electron density map of the ferroxidase ligands (blue mesh) contoured at 1σ and phased anomalous difference map of the ferroxidase center iron atoms (orange mesh) contoured at 3σ for the following BfrB mutant structures: A) C89S/K96C, B) N148L C) Q151L and D) D34F. Ferroxidase centers from as isolated proteins (devoid of iron) are on the left (gray sticks), and ferroxidase centers from iron-soaked structures are on the right (green sticks). Iron atoms are drawn as orange spheres and contacts to the ferroxidase center ligands are represented as dashed lines.
