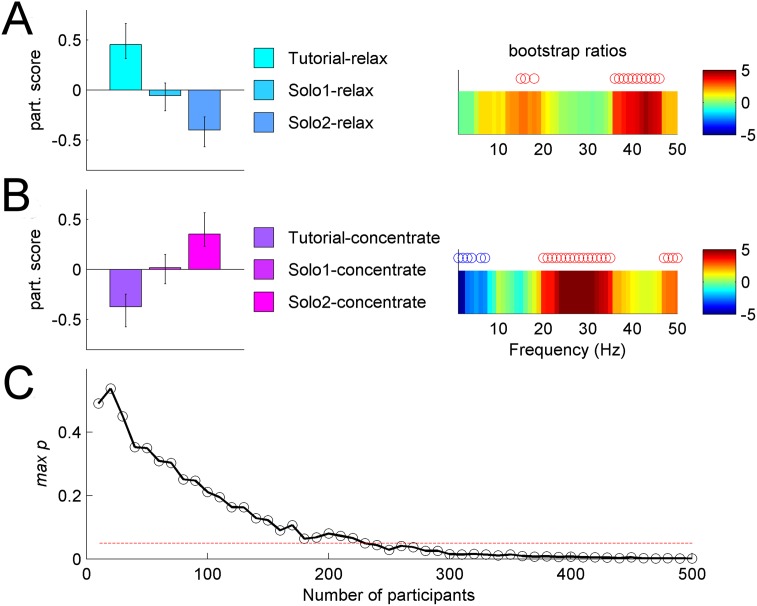
Fig 6. Training effects on brain states (example left frontal channel).
(A) Relaxation training effect. Left: mean participant scores with respect to the relaxation training effect, with error bars representing 95% CI. Right: associated frequency pattern with reliable positive (negative) bootstrap ratios indicated by red (blue) circles. Overall effect of relaxation training is a decrease in 17–18 Hz and 35–45 Hz frequency range. (B) Concentration training effect. Left: mean participant scores with error bars representing 95% CI. Right: associated frequency pattern with reliable positive (negative) bootstrap ratios indicated by red (blue) circles. Overall effect of concentration training is an increase in beta power (20–40 Hz frequency range) and a decrease in delta power (<3 Hz). (C) Reliability of concentration training effect across a series of analyses with varying number of participants, N. For each N we plotted mean estimate of the reliability measure maxp. Reliable results (maxp < 0.05, i.e., below the red dotted line) are consistently obtained when the number of participants is >>200.

