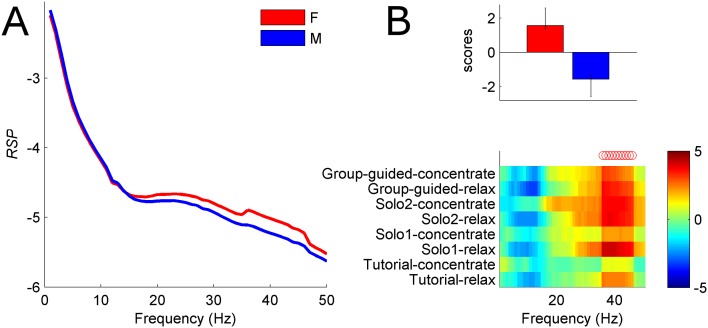
Fig 9. Sex differences in RSP (example left frontal channel).
(A) Mean RSP curves for males and females during Solo2-concentrate condition. (B) Sex effect across all guided conditions. Top: mean participant scores with error bars representing 95% CI. Bottom: associated frequency pattern, represented with bootstrap ratios across conditions. Reliable positive bootstrap indicated by red (blue) circles identify frequencies (35–45 Hz) where females have more power compared to males. Weak trend by which males exhibit more power alpha range (blue bootstrap ratios) is not consistently reliable across conditions.

