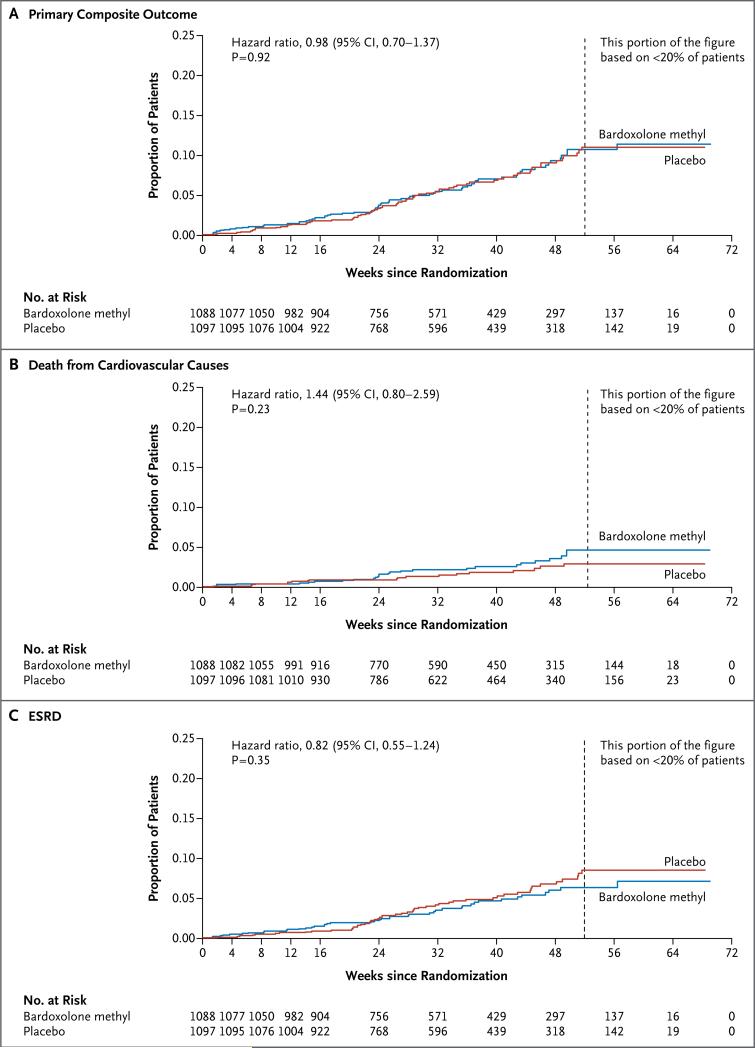
Figure 1. Kaplan–Meier Plots of the Time to the First Event of the Primary Outcome and Its Components.
Panel A shows the time to the first occurrence of the primary composite outcome (end-stage renal disease [ESRD] or death from cardiovascular causes) among patients in the bardoxolone methyl group and those in the placebo group. Panel B shows the time to death from cardiovascular causes in the two study groups, and Panel C the time to the development of ESRD in the two groups.

