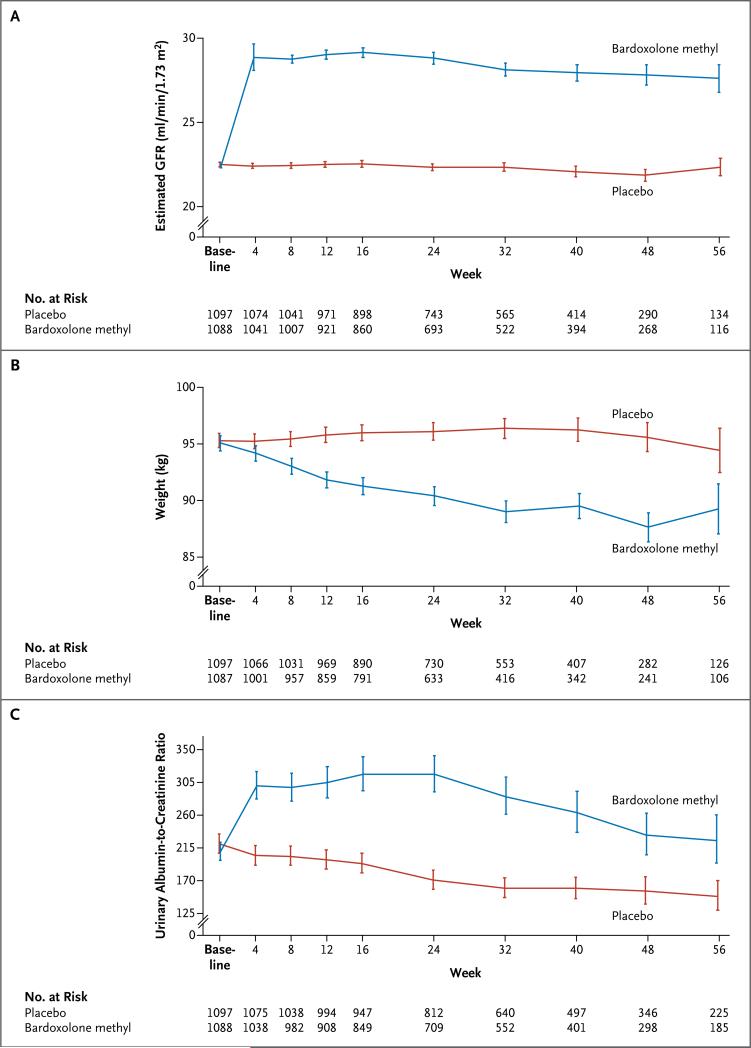
Figure 3. Estimated Glomerular Filtration Rate (GFR), Body Weight, and Urinary Albumin-to-Creatinine Ratio.
The urinary albumin-to-creatinine ratio is based on measurement of albumin in milligrams and creatinine in grams. For the estimated GFR and body weight, I bars indicate ±1 SE; for the urinary albumin-to-creatinine ratio, I bars indicate the antilog of the standard error for log urinary albumin-to-creatinine ratio.

