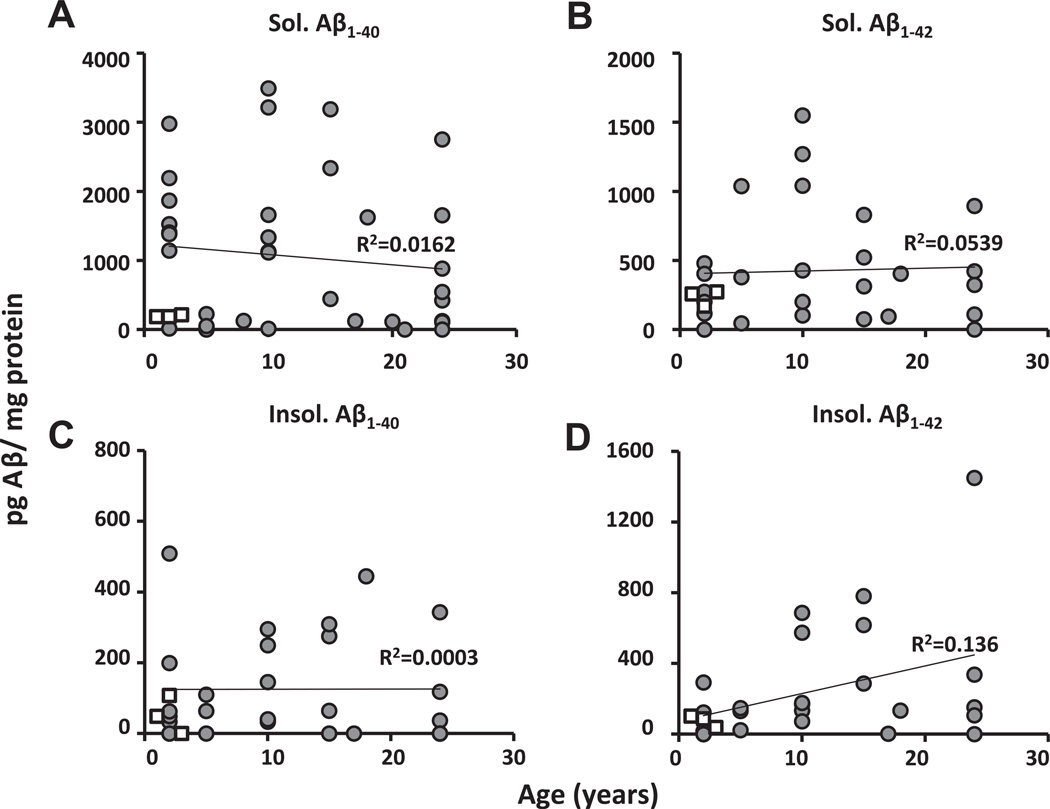
Fig. 5.
Levels of Aβ do not increase with age in NMRs. Levels of NMR (gray circles) soluble Aβ1–40 (A) and Aβ1–42 (B) did not increase with age (2–26 years; gray circles y=−16.48x + 1274.25; R2 = 0.0162, p = 0.44; y = 14.819x + 264.187; R2 = 0.0539, p = 0.155, respectively). Similarly, levels of insoluble Aβ1–40 (C) did not increase with age (y = −0.806x + 166.723; R2 = 0.0003, p = 0.914). In contrast, although insoluble Aβ1–42 (D) levels in young animals are comparatively very low, because of 1 very high value in the aged group, a significant positive correlation with age, was apparent (y = 23.53x + 1.314; R2 = 0.136, p = 0.022, respectively); however, if this 1 outlier is ignored, there was no significant relationship (y = 12.70x + 108.96; R2 = 0.094, p = 0.112). In all cases, NMR levels are within similar range to those of young (8-month-old) 3xTg-AD mice (open squares). All data points obtained in our experiments are represented; n = 39 for NMRs, n = 3 for 3xTg-AD mice.

