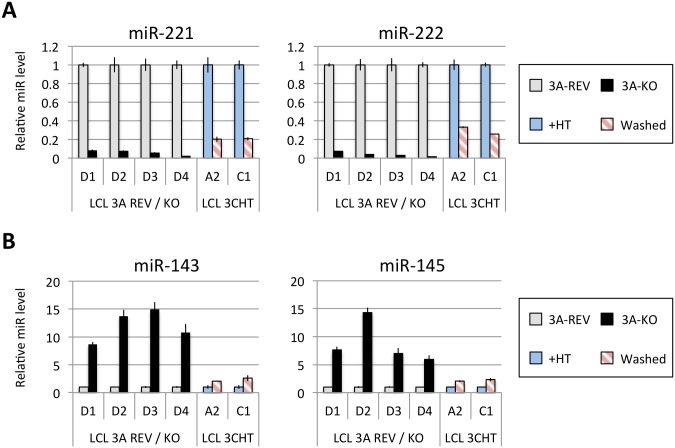
Fig 1. Regulation of miR clusters by EBNA3A and EBNA3C.
(A) MiR-221 and miR-222 expression in four independent LCLs EBNA3A-KO and EBNA3A-REV (D1, D2, D3 and D4) as well as two p16-null LCL 3CHT (A2 and C1) cultured for 29 days with (+HT) or without 4HT (Washed) were determined by real time quantitative RT-PCR (qPCR). MiR-221/miR-222 expression was normalized to RNU6B and is shown relative to each “wild type” cell LCL EBNA3A-REV (3A-REV) or p16-null 3CHT cultured with 4HT (+HT). (B) As in (A) but analysing miR-143 and miR-145 expression.

