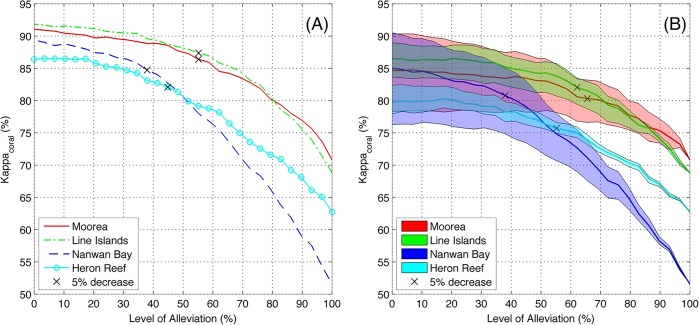
Fig 4. Alleviation levels for Hosts and Visitors.
Accuracy as measured by Cohen’s kappa for the task of discriminating corals from other labels, κ coral at various levels of Alleviation for the four studied locations. The subplots indicate: (A) accuracy of combined Hosts’ and automated annotations, and (B) accuracy of combined Visitors’ and automated annotations, both compared against the Archived annotations. The surfaces in (B) indicate the maximum and minimum combined accuracy among the five Visitors, and the solid lines indicate the mean. The black x on each curve indicates the point where κ coral was 5% lower than its maximum value (i.e. a 5% drop compared to the κ coral of the (A) Hosts, and (B) the mean of the Visitors).

