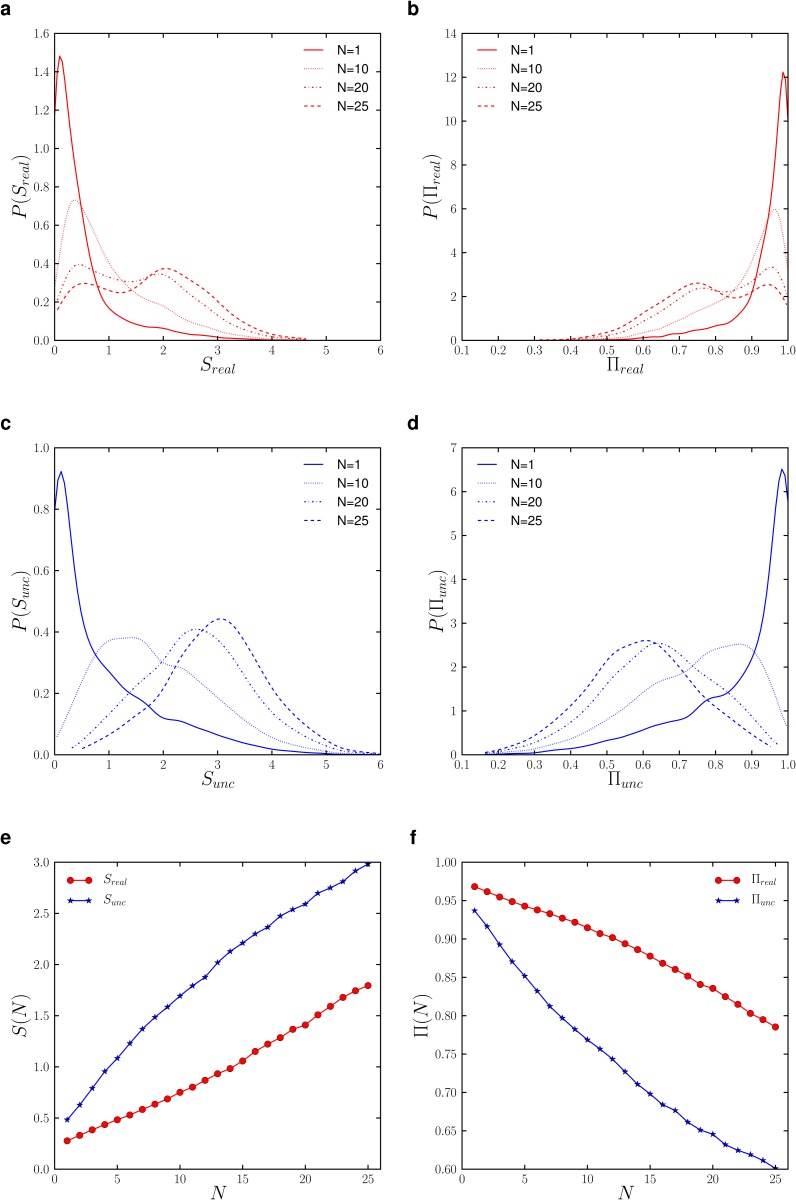
Fig 3. The entropy and predictability of individual tweet locations.
S real (a) and S unc (c) expectedly increase with the minimum number of tweet locations. A bimodal distribution in S real emerges from N = 20 and becomes more pronounced at N = 25 pointing to a group with very low randomness and high predictability and another group among users with highly diverse tweeting locations and lower predictability (b). The rates of entropy increase (e) and predictability decrease (f) are significantly lower for S real compared to S unc.

