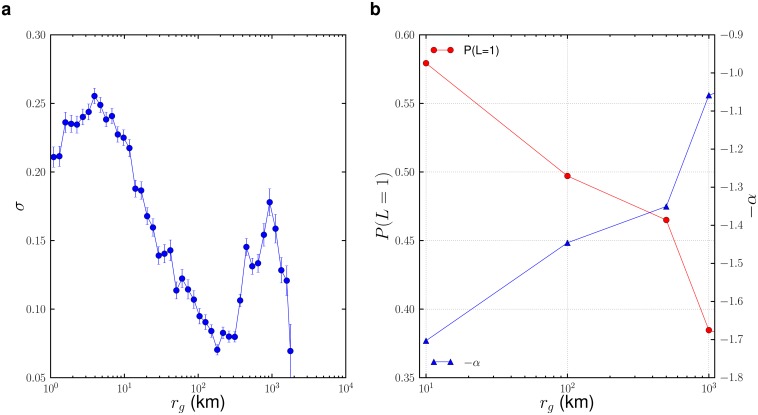
Fig 5.
(a)The isotropy ratio σ steadily decreases with r g before increasing again from 200km to around 1000km, indicating that popular intercity trips contribute to increased isotropy. (b) The probability of return to the most popular location and more generally the preference for previously visited locations both drop significantly with increasing r g.

